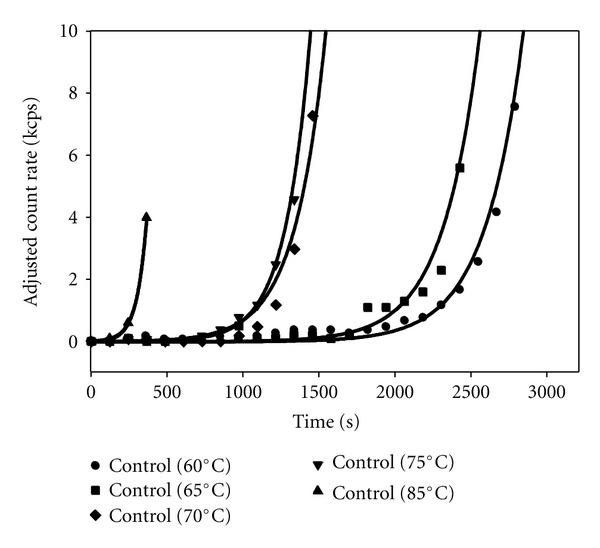
Figure 1.

Average scattered intensity measurements versus time after quenching at varying temperatures for 1 mM insulin in 20% acetic acid + 0.1 M NaCl solutions. The count rates were measured in sequential two-minute dynamic light scattering experiments and, for purposes of comparison, the count rates were adjusted by subtracting the average initial count rates (typically several kcps). The smooth curves are fits to the data using (1) as described in the text. Similar data were obtained from plots of hydrodynamic diameter versus time after quenching to different temperatures, with the lag times typically somewhat shorter (10–30%) from these data.
