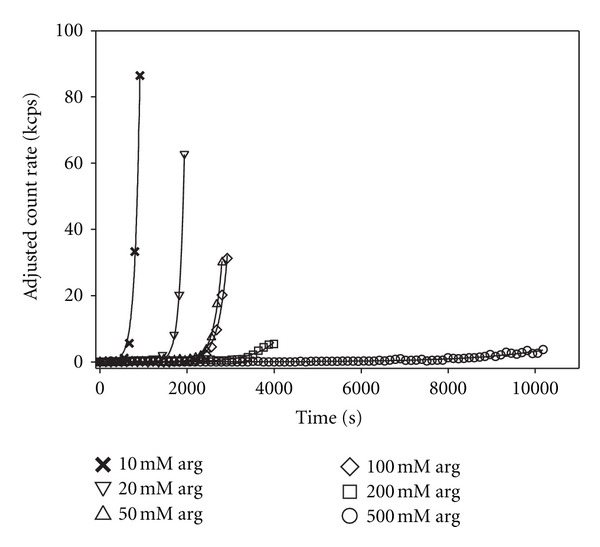
Figure 3.

Adjusted (as in Figure 1 caption) average scattered intensity versus time after quenching to 70°C for 1 mM insulin with varying amounts of L-arginine added. Note the longer time scale (compared to Figure 1), the longer lag times, and the apparent slower growth rates at increasing arginine concentrations.
