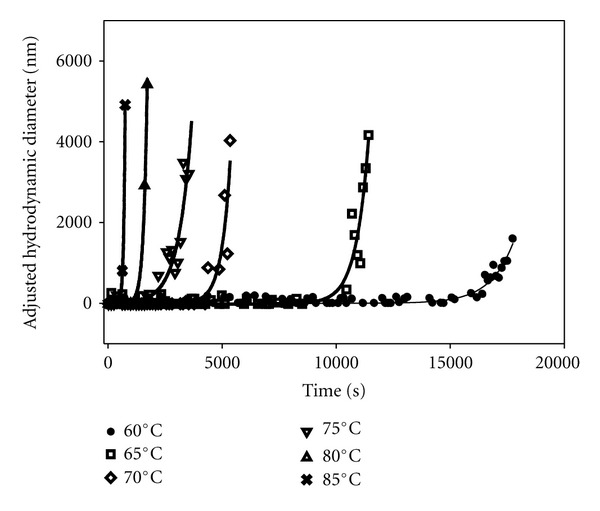
Figure 5.

Hydrodynamic diameters of scattering species versus time for solutions of 1 mM insulin with 500 mM arginine at varying quench temperatures. The data are adjusted by subtracting the mean diameter during the lag time period in order to fit to the same two-parameter expression in (1). The smooth curves are fits to the same functional dependence as in (1) replacing intensity with hydrodynamic diameter.
