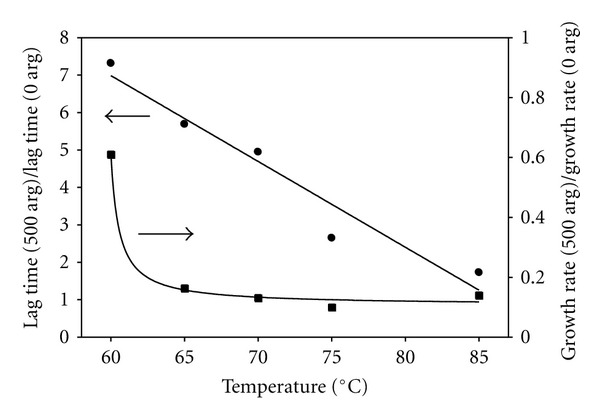
Figure 6.

Lag times and growth rates of 1 mM insulin in the presence of 500 mM arginine, each normalized by the corresponding value in the absence of arginine, as function of the quench temperature. The smooth curves are linear and exponential fits to the data.
