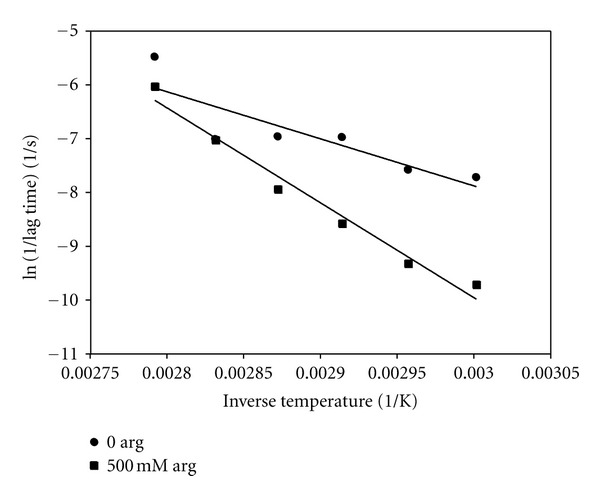
Figure 7.

Arrhenius plots of the natural logarithm of the initial phase rate (taken as the inverse of the corresponding lag time) versus inverse absolute temperature for 1 mM insulin in the presence of and absence of 500 mM arginine.

Arrhenius plots of the natural logarithm of the initial phase rate (taken as the inverse of the corresponding lag time) versus inverse absolute temperature for 1 mM insulin in the presence of and absence of 500 mM arginine.