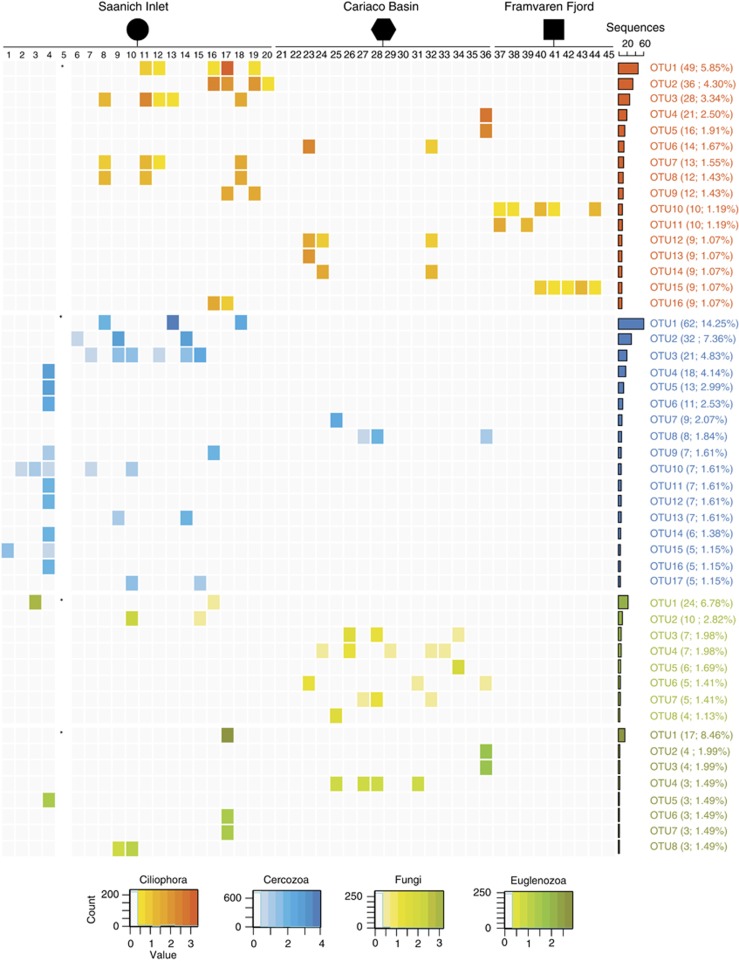
Figure 3.
Combined histogram and heatmap describing the diversity of Ciliophora, Cercozoa, Fungi and Euglenozoa OTUs among and between sampling depths and locations (see Table 1 for sample_id information). The heatmap shows the number of sequences in each OTU that are affiliated with each color-coded protistan group. Color intensity of each cell is proportional to the log-corrected number of sequences in the OTU. The histogram shows total number of uncorrected sequences in corresponding OTU (i.e., sum of sequences in a given OTU across all the samples). Only those OTUs are shown for which the total number of sequences is ⩾1% of the total sequences affiliated with a given taxa. The count legends indicate the number of cells in each heatmap that contain the designated log-corrected value.

