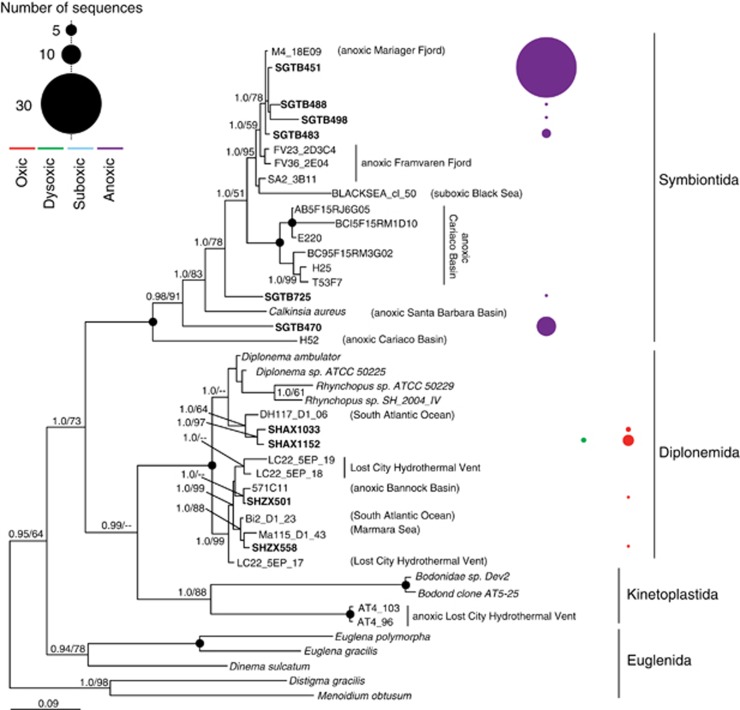
Figure 5.
Phylogenetic relationships of Euglenozoa-affiliated 18S rRNA gene sequences. The tree was constructed under maximum likelihood using an alignment of 809 unambiguous positions under the GTR+I+Gamma model of sequence evolution. Bootstrap (PhyML, 1000 iterations) and posterior probability (5 000 000 generations with 25% of trees discarded as burning) values >50% are shown at the nodes in the order PP/ML. Black circles at nodes represent full posterior probability and bootstrap support. OTUs from our study appear in bold font. The number of sequences per OTU recovered from oxic, suboxic, dysoxic and oxic samples are represented by circles. The size and color of the circles denotes the number of sequences and O2 concentration, respectively.

