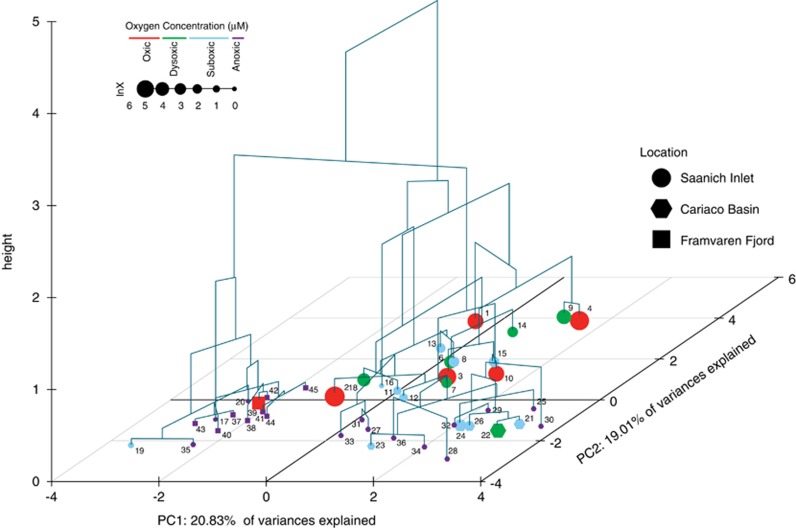
Figure 6.
PCA and hierarchical clustering of the 38 samples from Saanich Inlet, Cariaco Basin and Framvaren Fjord (see Table 1 for sample_id information). The x and y axes of the grid represent the first and second principal components, respectively. Each dot represents one of the 38 samples used in the analysis. The visual properties of each dot can be divided into three categories. The shape of each dot represents sample location, Saanich Inlet (circle), Cariaco Basin (hexagon) and Framvaren Fjord (square). Each dot is color-coded based on dissolved O2 concentration, oxic (red), dysoxic (green), suboxic (light blue) and anoxic (purple). The size of each dot is scaled according to the value of the O2 concentration (in μM) normalized using natural logarithm (ln). The clustering pattern is further linked to the dendrogram generated from hierarchical clustering.

