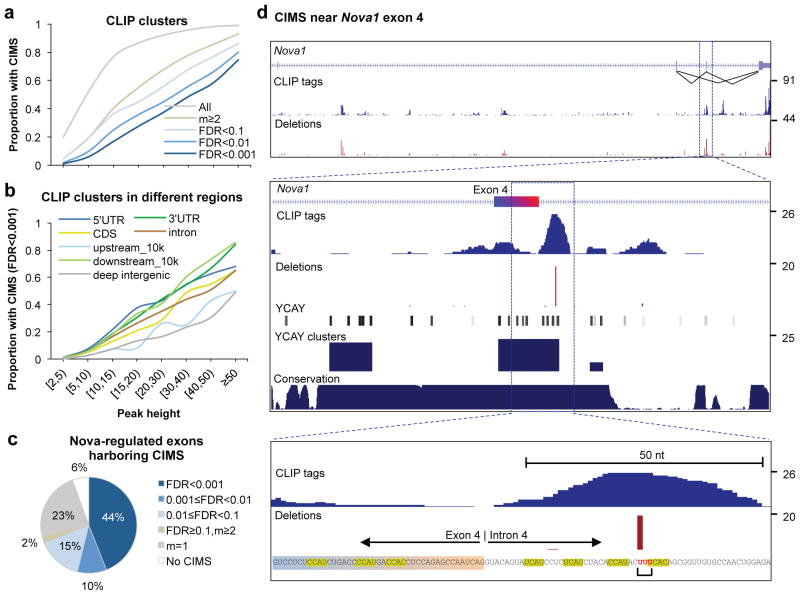
Figure 3. Frequency of CIMS in CLIP tag clusters and association of CIMS with Nova regulated alternative exons.
a. The proportion of CLIP tag clusters in genic or extended 3′ UTR regions (10k nt downstream of transcript termination) which harbor CIMS defined with varying stringency is shown as a function of CLIP tag cluster peak height (PH).
b. Similar to (a) but CIMS are defined with FDR<0.001 and CLIP tag clusters in different genomic regions are shown separately for comparison.
c. The breakdown of 325 non-redundant Nova-regulated cassette exons is shown, according to whether they have CIMS in the alternative exon, or upstream or downstream introns that are important for Nova-dependent alternative splicing regulation. CIMS are defined with varying stringency, similar to (a).
d. An example (Nova1 exon 4) of CIMS that precisely maps Nova-RNA interactions. Top panel: the Nova1 gene locus, with the number of CLIP tags and frequency of deletions shown in blue and red, respectively. Inclusion or exclusion of exon 4 is autoregulated by Nova 5. Middle panel: a zoom-in view of exon4 and flanking intronic sequences. In addition to CLIP tags and deletions, positions of YCAY elements, scores of bioinformatically predicted YCAY clusters 23, and cross-species sequence conservation in mammals are shown. Bottom panel: A further zoom-in view of sequences around the CIMS. YCAY elements and the nucleotides with deletions are highlighted. Note that although the alignment algorithm assigned the deletion to the first of the three uridines shown in red, the actual location could be any of the three nucleotides.

