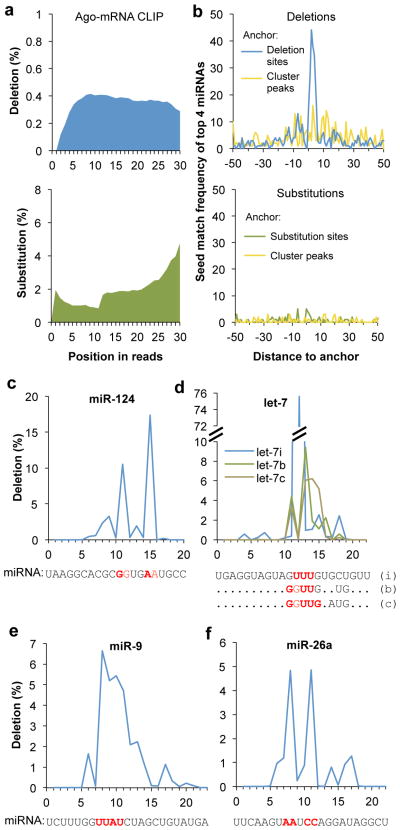
Figure 5. Cross-linking induces deletions, but not substitutions, that precisely map Ago-mRNA and Ago-miRNA interaction sites.
a. The positional profiles of deletions (top panel, blue) and substitutions (bottom panel, green) on Ago mRNA CLIP tags relative to 5′ end of reads.
b. Top panel: frequency of miRNA seed matches starting at each position around clustered deletion sites is shown for four top miRNAs (miR-124, miR-9, let-7, and miR-26) with the most seed enrichment and abundant in the brain (blue curve). The same CLIP clusters are re-anchored at the CLIP tag cluster peak to calculate the positional frequency of seed matches shown in the yellow curve. Bottom panel: similar to the top panel, but the frequency of miRNA seed matches around clustered substitution sites (green) or around CLIP tag cluster peak of the corresponding CLIP clusters (yellow curve) is shown.
c–f. Positional frequency of deletions for representative individual miRNAs abundant in brain: miR-124 (c), let-7i, b, and c (d), miR-9 (e), and miR-26a (f). For each miRNA, the sequence is shown at the bottom, with inferred crosslink sites highlighted in red.

