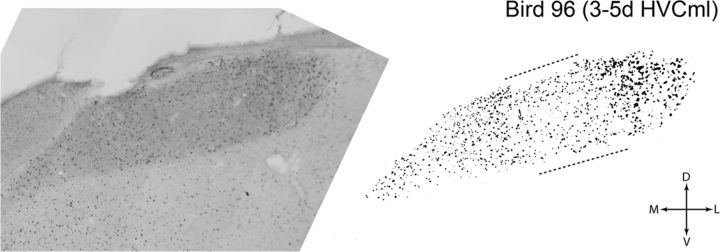
Figure 3.
High-resolution bright-field composite images of HVC were used to generate binary images of singing-driven ZENK (IEG) labeling for quantification. Shown is an image of singing-driven IEG labeling in a coronal section from the rostral half of HVC, taken from a bird that was processed 3 d after HVC microlesions (3–5d HVCml group). The bright-field image at left is a composite of multiple bright-field images captured with a 20× objective. At right is the binary image of IEG labeling that was extracted from the high-resolution bright-field composite. Microlesions in this bird were located near the caudal pole of HVC, and this coronal section (which is 480 μm rostral of the microlesion) shows a region of reduced IEG labeling (bracketed by dashed lines) that aligned with the mediolateral position of the microlesion. For additional details on quantification of IEG labeling, see Materials and Methods. D, Dorsal; L, lateral; M, medial; V, ventral.

