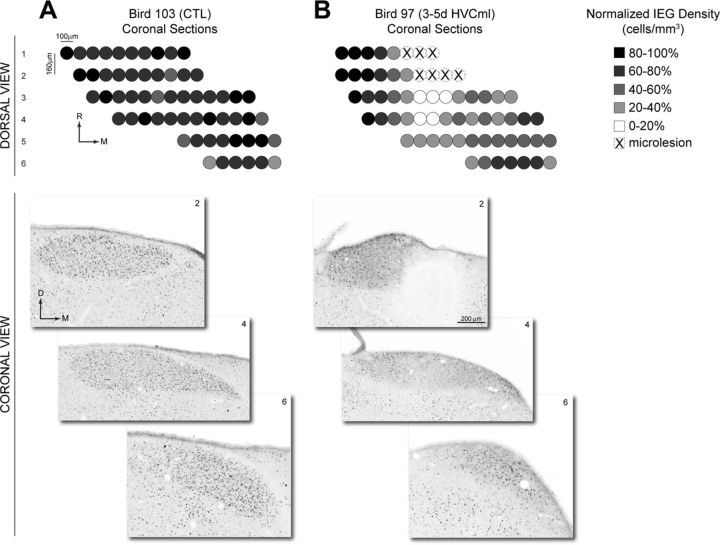
Figure 6.
Quantification of the spatial organization of ZENK (IEG) labeling in coronal sections of HVC. The density of IEG labeling was measured in 100 μm increments across the mediolateral axis of n = 6 coronal tissue sections from a representative CTL bird (A) and a representative 3–5d HVCml bird (B). Individual tissue sections were 40 μm thick and selected for analysis at 160 μm intervals. Density values were normalized to the 100 μm increment with the highest labeling density in each bird. Normalized density values were then rotated 90° to provide a dorsal view of HVC (compare with Fig. 1). Bright-field images below show IEG labeling in sections 2, 4, and 6 from each bird, arranged according to their position relative to the midline. Under B, the bright-field image from section 2 of the 3–5d HVCml bird contains microlesion damage. M, Medial; R, rostral; D, dorsal.

