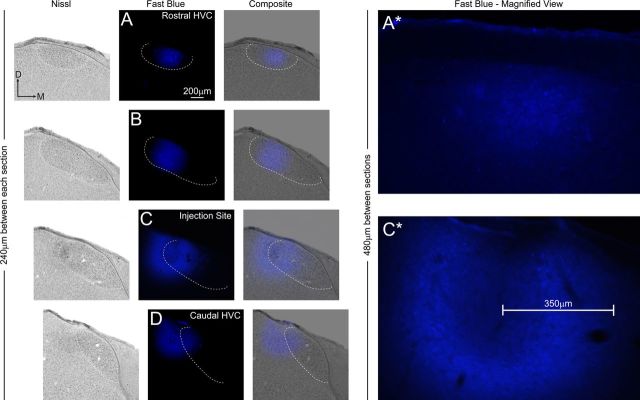
Figure 8.
Rostrocaudal organization of HVC neural connectivity as demonstrated by focal injection of fast blue. At left, four coronal tissue sections (A–D) selected at 240 μm increments span the rostrocaudal axis of HVC. Each section is shown under bright-field (Nissl) and fluorescent (fast blue) illumination. The third column (Composite) shows composites of bright-field and fluorescent images from each section. In all images, the Nissl-defined borders of HVC are indicated by a white dashed line. The horizontal offset in each successive row of images accommodates the medial shift that occurs between rostral and caudal poles of HVC (see Fig. 1). In this bird, a laterally situated dye injection near caudal HVC (C) produces retrograde labeling within the medial half of rostral HVC (A), indicating a pattern of retrograde labeling aligned to the rostrocaudal axis of HVC. The right panel (Fast Blue − Magnified View) shows high-magnification images of fast blue labeling in sections that were adjacent (in the rostral direction) to A and C in the left. The scale bar in C* shows that the radius of passive diffusion of fast blue away from the injection site was ∼350 μm. The retrograde cell labeling in rostral HVC (A*) is located at a distance of 480 μm away from the injection site, exceeding the radius of passive diffusion of the dye. Overexposure of the fast blue injection sites in C and C* ensured capture of cell labeling medial to the injection site; such labeling was limited in extent compared with the labeling present in rostral HVC. D, Dorsal; M, medial.

