

Abstract
Background and Aims
Phylogenetic clustering of species within plant communities can be expected to result from environmental filtering acting on an evolutionary-conserved plant trait. One such a candidate trait is the embryo to seed-size ratio (E:S). A high E:S may allow faster germination immediately after imbibition, and is therefore assumed to be advantageous in dry habitats. In this study the hypothesis was tested that habitat filtering driven by soil moisture conditions and acting on seed germination and seedling establishment is an important ecological mechanism in structuring temperate plant communities.
Methods
Vegetation samplings were performed in three habitats located within 200 km of each other in western Europe: Ellenberg indicator values showed that the habitats selected differed substantially in terms of soil moisture and light availability. E.S ratio and seed mass data for all genera were obtained from literature. Data were analysed using recently developed phylogenetic methods.
Key Results
Genera with a similar E:S tend to co-occur, as low and high E:S genera dominate in moist and dry habitats, respectively. A phylogenetically clustered pattern of community structure was evident, and dispersion of E:S was positively related to phylogenetic dispersion.
Conclusions
The phenotypically and phylogenetically clustered pattern indicates that E:S-mediated habitat filtering is an important assembly process structuring the plant community of the temperate climate habitats studied.
Keywords: Calcareous grassland, dune slacks, embryo size, habitat filtering, phylogenetic structure, plant community structure, seed mass, temperate forest
INTRODUCTION
Together with the availability of well-resolved species phylogenies and of quantitative tools to analyse them, awareness has risen that the phylogenetic structure of local communities may provide insight into processes governing community assembly (Hardy and Senterre, 2007; Vamosi et al., 2009; Pausas and Verdú, 2010). Coexistence of closely related species within plant communities, i.e. phylogenetic clustering, can be expected to result from environmental filtering acting on a conserved plant trait (Webb et al., 2002) or from divergence of trait states (Prinzing et al., 2008). If trait states, the values a trait can take, diverge among closely related species, then they will not compete and their coexistence will be allowed (Beltrán et al., 2012; Verdú et al., 2012).
The framework of Webb et al. (2002) also implies that competitive exclusion of closely related species can result in phylogenetic evenness. Recent insights, however, have shown that competitive exclusion may also result in phylogenetic clustering, depending on competitive ability and the magnitude of niche differences between species (Mayfield and Levine, 2010). Competition can exclude distantly related species and result in a clustered community structure when traits advantageous in competition are phylogenetically conserved. Moreover, habitat filtering and competitive exclusion might interact, i.e. species that are not adapted to the prevailing habitat conditions are filtered out and this is confounded by increased competition (Grime, 2006). To overcome these complicating issues, it has been suggested to broaden the definition of environmental filtering by including competitive exclusion due to competitive ability differences (Mayfield and Levine, 2010). Other processes such as facilitation, mutualism and predation have also been shown to result in non-random phylogenetic community structure (Valiente-Banuet and Verdú, 2007; Vamosi and Vamosi, 2007; Elias et al., 2008). Not only phylogenetic, but also trait-based tests may inform us about the underlying community assembly processes, but have seldom been applied to the same community (Kraft and Ackerly, 2010).
The regeneration phase, and seedling establishment in particular, is a major bottleneck in the plants' life history, potentially affecting the species composition of established plant communities (Hanley, 1998). The inability of seedlings to establish under certain environmental conditions can be expected to act as a strong habitat filter (Vandervalk, 1981; Lord et al., 1995). This filtering process may result in a phenotypically and phylogenetically clustered pattern of community structure, as was clearly shown in Mediterranean plant communities, where filtering of species in fire-prone habitats depends partially on the ability of seeds to germinate after fires (Verdú and Pausas, 2007; Ojeda et al., 2010). The size, composition and location (in the cotyledons or in extra-embryonic tissues) of the food reserves in seeds play an important role in the timing of seed germination, the seedling growth rate and competitiveness of seedlings (Hanley et al., 2004; Soriano et al., 2011). Therefore, two functional seed traits that can profoundly affect seed germination and seedling establishment are seed mass and the embryo to seed size ratio (E:S). The latter trait could very well affect plant community composition, since storing food reserves in the cotyledons may allow faster germination and increase seedling vigour (Stebbins, 1974). Faster germination would be particularly beneficial in dry habitats, enabling seedlings to make maximal use of short periods of moisture (Hodgson and Mackey, 1986; Vandelook et al., 2012). Additionally, many species with endospermic seeds require a prolonged period of post-dispersal embryo growth before seeds can germinate, excluding these species from habitats subject to extensive dry periods (Fenner and Thompson, 2005).
A strong phylogenetic signal and considerably more variation in E:S among families than within families both indicate that E:S is an evolutionarily conserved trait among angiosperms (Forbis et al., 2002; Verdú, 2006). A low E:S is considered an ancestral feature in angiosperms, while an evolutionary trend towards increasing E:S resulted in high values in several derived taxa. Analysis of the tempo of evolution indicated that E:S changed very fast early in angiosperm evolution, and that it remained stable later (Verdú, 2006).
The role of seed mass in structuring plant communities has already been extensively explored. Many studies showed that seed mass is related to light availability, whereby large seeded species have an advantage under low light conditions (e.g. Leishman and Westoby, 1994; Hodkinson et al., 1998; Thompson and Hodkinson, 1998). Relationships between seed mass and soil moisture, nutrients and acidity have also been observed, but evidence is more limited (Leishman et al., 2000). Moreover, the relationship between seed mass and nutrient availability has been shown to depend on habitat-specific differences (Hanley et al., 2007). Reports about the extent of phylogenetic signal in seed size are contradictory, as similarities in seed sizes between relatives lower (Zanne, 2005) and higher (Mazer, 1989; Prinzing et al., 2008) than expected by chance have been recorded.
Here we test the general hypothesis that habitat filtering acting on seedling establishment is an important ecological mechanism in structuring temperate plant communities. Since E:S is a highly conserved trait, we can expect two patterns emerging if our hypothesis is true. First, species with a similar E:S will tend to co-occur in the same habitat type, resulting in a phenotypically clustered community structure. Secondly, under the habitat filtering hypothesis, a phylogenetically clustered plant community structure can be expected (Webb et al., 2002). Additionally we expect that seed mass, assuming that it has a lower phylogenetic signal, also contributes significantly to the phenotypic, but less to the phylogenetic community structure.
We tested our hypotheses over three very different habitats: wet dune slacks, mesic deciduous forests and dry calcareous grasslands, representing a large gradient in light and soil moisture conditions. This approach has the advantage that co-occurrence of phylogenetically related species under similar climatic conditions provides additional evidence for habitat filtering. We also examined the alternative hypothesis that coexistence of closely related species is possible due to divergence of trait states (Prinzing et al., 2008). If this is true, the measures of phylogenetic and trait state dispersion per plot should be negatively correlated, indicating that closely related species have evolved divergent trait states. Finally, we tested the additional hypothesis that, as a small E:S is an ancestral condition that changed very fast early in angiosperm evolution, the evolutionary signal in the communities with a non-random phenotypic and phylogenetic structure can be traced back towards the base of the phylogeny.
MATERIALS AND METHODS
Data collecting
Study area and vegetation sampling
Vegetation samplings were retrieved from previous studies; more details on sampling methodology can be found in the respective references (Table 1). To exclude large-scale biogeographical effects, the selected habitats were all located within 200 km of each other (50°02′N–51°05′N; 2°32′E–4°38′E). Although the three habitats studied are situated in the same climate region, they are clearly distinct with respect to the soil moisture content and light availability. The dune slacks sampled are located in four nature reserves along the Belgian and north-western French coasts (Bossuyt et al., 2003). A total of 83 dune slacks, ranging from 20 m2 to 0· 13 km2, were surveyed by sampling a variable number of plots in each dune slack. The calcareous grasslands surveyed are situated in the Calestienne region along the Viroin valley. The vegetation was sampled in multiple plots distributed over 54 fragments of calcareous grassland scattered over a region of approx. 4 km wide and 20 km long (Butaye et al., 2005). Two deciduous forests, considered as one habitat type, were included in this study. Langerodebos is located about 8 km south-west of Leuven (O. Honnay, unpubl. data). The second forest, Vorte Bossen, is located 20 km to the south-west of Brugge (Lameire et al., 2000).
Table 1.
Total number of plots sampled in the three habitat types differing profoundly in moisture and light conditions
| Plots | Genera | Genera per plot | Reference | |
|---|---|---|---|---|
| Dune slacks | 484 | 85 | 7·5 ± 3·1 | Bossuyt et al. (2003) |
| Calcareous grassland | 204 | 167 | 25·5 ± 6·6 | Butaye et al. (2005) |
| Forest | 85 | 92 | 15·2 ± 8·7 | |
| Vorte Bossen | 28 | 67 | Lameire et al. (2000) | |
| Langerodebos | 57 | 79 | O. Honnay (unpubl. data) |
The number of genera sampled and mean number of genera (± s.d.) per plot in each habitat are given. Sampling data were retrieved from the references listed.
The vegetation in the different habitats was sampled in plots ranging from 1 × 1m in the dune slacks and the calcareous grasslands, up to 10 × 10m and 10 × 15m in the forests. Plot size was not correlated with any of the metrics for phylogenetic structure and therefore confounding effects of plot size with phylogenetic structure can be discarded. A variable number of plots from the different habitats were included in the study (Table 1). Planted Populus × canadensis trees were not taken into account, nor were ferns and two gymnosperms, because of differences related to spore and seed morphology. Ultimately, a total of 773 plots containing presence/absence data for 233 genera (402 species) were included in the analysis (Supplementary Data Table S1).
Trait data
E:S values of the genera sampled were obtained from Forbis et al. (2002). These are measurements of seed and embryo size from illustrations of the internal morphology of seeds drawn by Martin (1946). For genera in our study that were also represented in Martins' data set (74·8 %), we used the average E:S of all species in the genus (Supplementary Data Table S2). In the case of missing genera, we assigned the average E:S of all species from the same family. This generalization will have only a minor effect on the final results, since Forbis et al. (2002) already calculated that variation in E:S among families (>92·5 %) is significantly larger compared with within families (<7·5 %). Including genera for which E:S values were based on family means had a negligible effect on the phylogenetic signal (sensu Blomberg et al., 2003). For 177 genera we were also able to retrieve E:S data from other literature sources. A linear regression of the alternative data with the Martins' data set confirmed the validity of the latter (t = 54·5, r = 0·97, P < 0·001). Seed mass data were obtained from the Seed Information Database (http://data.kew.org/sid/). These data were converted from the species to the genus level by averaging data of all congeneric species sampled.
Environmental data
We used Ellenberg indicator values to obtain an estimate of soil moisture, light availability and nutrient level for each of the 773 plots (Ellenberg et al., 1992). Ellenberg values have been successfully used in other studies of phylogenetic plant community structure in Central Europe because they correlate well with environmental variables (Dzwonko, 2001). Ellenberg values were calculated using presence/absence data for each plot.
Data analysis
Phenotypic community structure
Mean trait values per plot were calculated for all three habitat types and compared using a one-way analysis of variance (ANOVA). We determined the phenotypic community structure by testing whether seeds of co-occurring genera have similar trait values (Cavender-Bares et al., 2004). Pairwise values of co-occurrence in all plots were calculated using a binary distance index. A Euclidean distance index was used to calculate pairwise distances between trait values of all species. Seed mass data were log transformed prior to analyses. The resulting co-occurrence and phenotypic distance matrices were correlated using a Mantel test with 999 permutations (Legendre et al., 1994). The analyses were performed with the ade4 software (Thiolouse et al., 1996) implemented in R version 2·7·2 (R Development Core Team, 2008).
Phylogenetic community structure
For consistency with the phenotypic data, we chose the genus as the taxonomic level of study. We also ran all the analyses at the species level and the results were qualitatively identical to those at the genus level, keeping the conclusions unaltered. A phylogenetic tree containing all 233 genera was assembled using the Phylomatic 2 software implemented in Phylocom 4·1 (Webb et al., 2009). This tree was obtained by matching the genus and family names of the sampled taxa with the angiosperm megatree (APG3; version R20091110.new), which is based on the work of the Angiosperm Phylogeny Group (Stevens, 2001). Since Phylomatic only provides good resolution at the family level, infrafamiliar resolution was increased by manually resolving nodes based on literature data (Supplementary Data References). Finally we obtained a phylogenetic megatree of which 97 % of the nodes were resolved. This tree was dated according to Wikström et al. (2001), using the bladj function in Phylocom (Webb et al., 2009).
The phylogenetic structure of the regional pool was tested using different metrics, enabling us to characterize multiple aspects of community structure (Vamosi et al., 2009; Pausas and Verdú, 2010). The first metric we used to analyse the phylogenetic composition of individual plots was the net relatedness index (NRI; Webb et al., 2002). The NRI is a standardized measure of the mean phylogenetic distance (MPD) of taxa in a sample, relative to a phylogeny of a specified regional pool of taxa. The NRI increases with an increase in clustering and becomes negative in the case of overdispersion. The regional pool containing the genera in all plots was used as the reference pool. Decreasing the regional pool to the habitat level did not significantly affect the results obtained. To test whether NRI differed significantly from random expectation, the results were compared with those obtained by a null model created by randomly shuffling genera across the entire phylogeny. The results obtained were consistent with those of other null models. Calculation of NRI and the comparison with the null model was performed using the ‘comstruct’ function in the Phylocom package.
Phylogenetic dispersion and dispersion of trait states per plot were correlated to test whether co-occurrence of closely related taxa is the product of trait divergence instead of habitat filtering (sensu Prinzing et al., 2008). Trait dispersion was calculated as a standardized standard deviation (s.d.) of the E:S or seed size in each plot (following Prinzing et al., 2008). Phylogenetic dispersion was estimated as the inverse of NRI. The relative importance of each trait in the model was assessed using the relimp package in R (Firth, 2008). This method estimates the relative importance of two predictors in a glm model as the square root of the variance ratio quantity.
The second metric we applied to determine phylogenetic structure separates phylogenetic diversity into α- (within-site) and β- (among-site) components (Hardy and Senterre, 2007). Using the presence/absence data we calculated ΠST, which represents the relative increase of the mean phylogenetic distance between species sampled among sites vs. within sites. To determine whether phylogenetic clustering or overdispersion occurred, the ΠST value was compared with the pΠST value that was obtained after randomizing all species among the tips of the phylogenetic tree (999 permutations). After complete randomization, pΠST has a statistical expectation equal to zero. Clustering and overdispersion are observed when ΠST > 0 and ΠST < 0, respectively. Partial tree randomizations were performed on the total species pool to detect whether the observed community structure at the regional level is due to early or late branching in the phylogenetic tree. We included 15 different age thresholds, ranging from 10 to 227 million years, above which the tree was kept intact. The selected age threshold coincided with splits between major clades. We also randomized particular clades within the tree (Table 3), which allows us to test whether particular clades contribute significantly to under- or overdispersion. All these analyses were performed using the Spacodi software (SPACoDi_0-10) provided by Olivier Hardy (Hardy and Senterre, 2007; Hardy and Jost, 2008).
Table 3.
The phylogenetic signal (pΠST) of the community structure in temperate climate habitats calculated for separate Angiosperm clades
| pΠST | P-value | |
|---|---|---|
| Poales | 0·050 ± 0·004 | 0·59 |
| Asterales | 0·047 ± 0·001 | 0·48 |
| Rosales | 0·046 ± 0·001 | 0·01 |
| Asparagales | 0·046 ± 0·001 | 0·09 |
| Eudicots | 0·046 ± 0·003 | 0·59 |
| Whole phylogeny | 0·001 ± 0·012 | 0·01 |
Results for pΠST were obtained after partial tree randomization of specific clades in comparison with ΠST.
Means ± 95 % of the central values obtained after 999 randomizations of the specific clade.
RESULTS
Seed mass and the E:S ratio are fully independent of each other for the genera studied (Pearson correlation: r = 0·04; P > 0·05). Genera with a similar E:S tend to co-occur in plots from similar habitats, indicating that phenotypic clustering occurs (Mantel test: r = 0·02, P = 0·023); the same is true for genera with similar seed mass (Mantel test: r = 0·05, P = 0·018). A significantly negative relationship (t = –15·85; r = 0·49; P < 0·001) exists between mean E:S per plot and mean Ellenberg indicator values for moisture (Table 2, Fig. 1A). The mean E:S per plot increased with increasing habitat dryness and was significantly different for the three habitats studied (F2,772 = 169·62; P < 0·001). Mean indicator values for moisture and light of plants in separate plots each both explained >40 % of variation in mean seed mass (Fig. 1B). At the habitat level, mean seed mass per plot was significantly different for the three habitats studied (F2,772 = 592·225; P < 0·001) and increased with decreasing habitat light conditions.
Table 2.
Results of linear regression across all plots sampled in three temperate climate habitats
| Log seed mass (mg) |
E:S |
|||||
|---|---|---|---|---|---|---|
| t | r | P-value | t | r | P-value | |
| Light | –23·60 | 0·65 | 0·001 | –8·78 | 0·30 | 0·001 |
| Moisture | –24·61 | 0·66 | 0·001 | –15·85 | 0·49 | 0·001 |
| Nitrogen | 4·25 | 0·15 | 0·001 | 0·68 | 0·03 | 0·495 |
The mean log seed mass and embryo to seed size ratio (E:S) in each plot are dependent variables, and the mean Ellenberg indicator values for light, soil moisture and nitrogen calculated for separate plots are predictor variables.
Fig. 1.
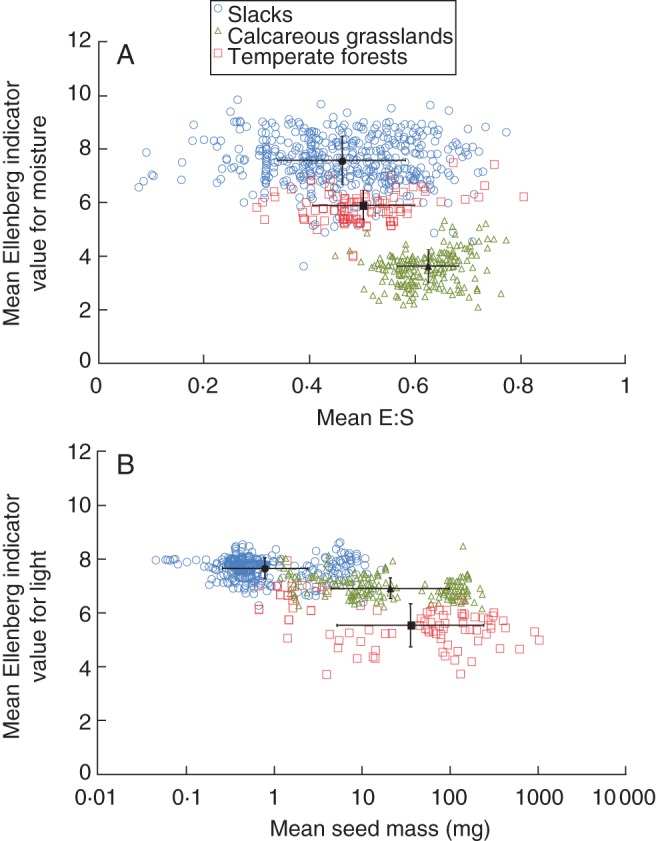
(A) The mean embryo to seed size ratio (E:S) per plot is negatively related to the mean Ellenberg indicator value for moisture per plot (open coloured symbols), for plots sampled in dune slacks, calcareous grasslands and temperate forests, as indicated in the key. (B) The mean seed mass per plot is negatively related to the mean Ellenberg indicator value for light. Solid black symbols denote mean values of the plots per habitat. Vertical and horizontal error bars represent standard deviations for the mean Ellenberg indicator value and mean trait values (solid black symbols), respectively.
Both E:S and seed size had significant phylogenetic signals (K = 2·1 and K = 0·31, respectively, P < 0·05 in both cases), indicating that closely related species resemble each other more than expected by chance. However, the amount of signal was 6·5 times greater for E:S than for seed size. The mean NRI of all plots combined was 0·07 ± 0·03 (mean ± s.e.), indicating a phylogenetically clustered community structure. A significant correlation exists between the mean E:S and NRI of the plots when a quadratic term was added (t = 17·78; r = 0·54; P < 0·001). This is because phylogenetic clustering tends to increase in plots with a mean E:S nearing either 0 or 1, while no significant phylogenetic structure appeared in plots with an intermediate E:S, except in a negligible number of plots where overdispersion arose (Fig. 2A). All plots with a significantly clustered structure and a low mean E:S (< 0·35) are located in the wet habitat (dune slacks), while those with a high mean E:S (>0·56) are related to the drier calcareous grassland and forest habitats. NRI significantly increased with increasing seed mass per plot (t = 11·29; r = 0·38; P < 0·001; Fig. 2B). Adding a quadratic term only marginally improved the correlation.
Fig. 2.
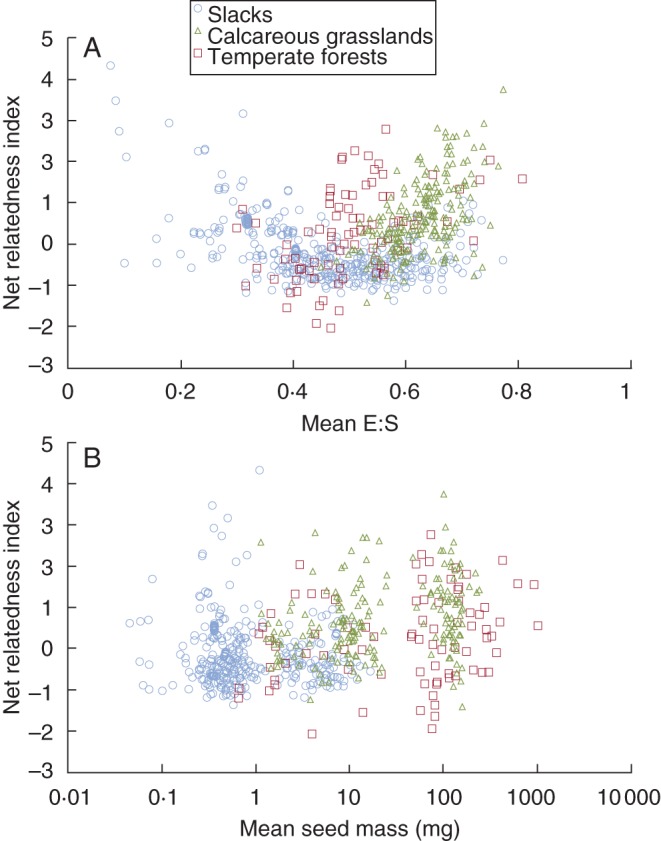
The relationship between (A) mean embryo to seed size (E:S) and (B) mean seed mass per plot and the net relatedness index (NRI) for each plot reveals that the phylogenetic structure of temperate climate habitats is related to the phenotypic structure. Plots were sampled in dune slacks, calcareous grasslands and temperate forests, as indicated in the key in (A).
Contrary to the expectation of the hypothesis that trait divergence may allow the coexistence of closely related species, we found that the dispersion of E:S (0·31 ± 1·00; mean ± s.d.) is positively related to phylogenetic dispersion measured as the inverse of NRI (t = 20·54; r = 0·60; P < 0·001) in the study plots. Seed mass dispersion (–0·09 ± 0·69), on the other hand, is negatively related to phylogenetic dispersion (t = –8·80; r = 0·30; P < 0·001). When looking at the relative importance of both traits in a combined model, we found that E:S dispersion was approx. 4 times (ratio of effect standard deviations) more important than dispersion of seed mass in explaining phylogenetic structure.
The observed ΠST (0·047) was significantly larger than zero (P = 0·02) after complete randomization of the phylogenetic tree, again indicating phylogenetic clustering. Partial tree randomizations at specific time intervals did not result in a ΠST significantly different from zero. Partial randomization of specific clades showed significant phylogenetic clustering within Rosales, but not in the other major clades tested (Table 3). Genera of the Rosales clade in this study had a mean E:S of 0·88 ± 0·08. Rosales species were most frequent in the calcareous grassland, with on average 3·7 species per plot, as compared with 0·5 and 2·7 species per plot in the dune slack and forest habitat, respectively.
DISCUSSION
The E:S is an evolutionarily conserved trait directly linked to the rate of seed germination and thus plant recruitment (Verdú, 2006). The E:S was already reported to vary with habitat moisture conditions (Hodgson and Mackey, 1986). Here we formally showed that genera with high E:S are over-represented in dry habitats, clearly indicating that community structure is phenotypically and, consequently, phylogenetically clustered, as we discuss below. Although seed mass, widely regarded as an import functional trait (Westoby, 1998; Weiher et al., 1999), had a clear relationship to the phenotypic community structure, with seed mass increasing with decreased light availability, it was much less important in determining phylogenetic community structure.
A phylogenetically clustered pattern of community structure emerged from two of the metrics calculated, NRI and ΠST. Additionally, phenotypic clustering was observed for both seed traits, indicating that co-occurring genera tend to have similar trait states. The proposition that closely related species may coexist if they diverge in niche traits would result in a negative correlation between phenotypic and phylogenetic dispersion (Prinzing et al., 2008). Although we also observed this relationship for seed mass, we did find that this relationship is positive for E:S. Additionally, dispersion of E:S is much more important than seed mass dispersion, confirming that E:S-based filtering dominates over past divergence of trait states. Since E:S is a strongly conserved trait, we can conclude that filtering may be an important assembly process structuring the plant community studied.
The reduction in the range of E:S values we observed, especially in the calcareous grassland plots, provides an additional indication of habitat filtering (Cornwell et al., 2006; Kraft et al., 2008). This is because environmental filtering should limit the range of strategies found in a community, as we find here. The observation that the Rosales clade, characterized by a high E:S and most frequent in dry calcareous grasslands, contributes significantly to phylogenetically clustering agrees with the E:S-based habitat filtering process. Our design does not allow us to differentiate between seedlings failing to establish due to abiotic conditions in the habitats studied, i.e. habitat filtering sensu stricto, or due to competitive ability differences, i.e. habitat filtering sensu lato (Mayfield and Levine, 2010).
A reduced range of E:S values in plots with low mean Ellenberg indicator values for moisture suggests that soil moisture availability may be one important factor that drives filtering of species in temperate climate habitats (Hodgson and Mackey, 1986; Vivrette, 1995). It has been hypothesized that a low E:S is the ancestral state, and that early angiosperms were mainly restricted to moist habitats, while the subsequent evolution towards an increased E:S enabled angiosperms to colonize new habitats (Forbis et al., 2002; Verdú, 2006). Partial tree randomizations showed that the clustered pattern of community structure was not observed until the whole tree was randomized, thus the evolutionary signal in the communities with a non-random phenotypic and phylogenetic structure can be traced back towards the root of the phylogeny. Therefore, the rapid change of E:S early in angiosperm evolution appears to be still reflected in the habitats studied. The negative relationship between seed size and the Ellenberg indicator values for light to a large extent can be explained in terms of the strong correlation between seed size and plant size (Moles et al., 2005; Wright et al., 2007). Furthermore, seedlings from large seeds, with more protein and lipid reserves, may have a competitive advantage and an increased establishment success under stressful environmental conditions (Leishman et al., 2000; Soriano et al., 2011). The latter mechanism is confirmed in this study, since a negative relationship between seed mass and indicator values for light and moisture exists.
Several propositions have been made about the ecological advantages of storing reserves in the embryo rather than in the endosperm or some other reserve tissue. It has been suggested that the evolution towards storage of food reserves in the embryo resulted in an increased germination rate (Stebbins, 1974). Such a positive relationship between germination rate and E:S has indeed been observed for Mediterranean climate species (Vivrette, 1995). In seeds with an underdeveloped embryo at dispersal, germination is delayed because of a period of embryo growth inside the seed prior to germination, a mechanism termed morphological dormancy (Baskin and Baskin, 1998). An additional cause for slower germination might be a reduced mobilization rate when reserves are stored outside the embryo. A reduction in the number of days required for germination (Verdú, 2006) together with a tendency towards increasing E:S throughout angiosperm evolution (Martin, 1946; Forbis et al., 2002) seemingly suggests a correlated evolution between both traits. However, the lack of a correlation between E:S and the rate of germination when phylogenetic relatedness is taken into account discards this scenario and suggests that both traits are associated by common ancestry and strong phylogenetic conservatism at profound levels of the angiosperm phylogeny (Verdú, 2006). Interestingly, at lower taxonomic levels, such as those occurring within the Apiaceae (a family known to require embryo growth inside the seed prior to germination), a significant positive phylogenetic correlation between embryo length and germination rate exists (Vandelook et al., 2012). A higher germination rate combined with the fact that embryo growth inside the seeds only occurs when seeds are imbibed means that a high E:S would be particularly beneficial in dry habitats (Fenner and Thompson, 2005). In grasslands with a dense above-ground plant cover and consequently high rates of light competition (Price et al., 2012), such as the calcareous grasslands we examined, more rapid germination also provides a competitive advantage. Hence species with a low E:S ratio would not reach the adult stage, but will be outcompeted. Experiments dealing with functional ecology of seed traits such as seed mass and the E:S ratio are particularly scarce and certainly deserve further investigation.
A quadratic relationship between phylogenetic structure and a trait expressed as a ratio, such as E:S, is expected when the trait considered is highly phylogenetically conserved. Plots showing significant phylogenetic clustering had both extreme E:S values and low variation. In contrast, plots with intermediate mean E:S values had high trait variation, and a significantly clustered pattern was never observed. As mentioned before, the selective exclusion of low E:S species in dry plots is likely to be an important process resulting in clustering of species with a high E:S ratio. Since no reduction in the range of E:S was observed in moist plots, phylogenetic clustering in plots composed of low E:S species may also result from secondary correlations between E:S and some other traits. These plots consist mainly of graminoid species and are all situated in the dune slack habitats. Like all graminoids, these species typically have copious endosperm, but they also evolved specific adaptations to survive regular flooding in these dune slacks (Grootjans et al., 1998).
In summary, we obtained good indications that habitat filtering acting on traits related to seed germination is one important mechanism in determining the phenotypic and phylogenetic structure of temperate climate plant communities. Genera with low E:S seeds are under-represented in dry habitats and the E:S is a strongly conserved trait resulting in a phylogenetically clustered pattern of plant community structure. Nonetheless, actual measurements of environmental conditions as well as the assessment of biotic interactions, such as dispersal limitation and competition, are certainly needed to expose other possible mechanisms affecting the structure of temperate climate habitats.
SUPPLEMENTARY DATA
ACKNOWLEDGEMENTS
We thank Tara Forbis for providing the data on the E:S and Olivier Hardy for providing access to the Spacodi software. We are grateful to Juli Pausas for helping with the statistical analyses. H. Jacquemyn, and J. Pausas improved the manuscript by providing useful comments. This work was funded by the Research Foundation-Flanders (FWO) and was conducted at the Centro de Investigaciones sobre Desertificación (CIDE) in Valencia.
LITERATURE CITED
- Baskin CC, Baskin JM. Seeds. Ecology, biogeography, and evolution of dormancy and germination. San Diego: Academic Press; 1998. [Google Scholar]
- Beltrán E, Valiente-Banuet A, Verdú M. Trait divergence and indirect interactions allow facilitation of congeneric species. Annals of Botany. 2012 doi: 10.1093/aob/mcs089. in press. http://dx.doi.org/10.1093/aob/mcs089 . [DOI] [PMC free article] [PubMed] [Google Scholar]
- Blomberg SP, Garland T, Jr, Ives AR. Testing for phylogenetic signal in comparative data: behavioral traits are more labile. Evolution. 2003;57:717–745. doi: 10.1111/j.0014-3820.2003.tb00285.x. [DOI] [PubMed] [Google Scholar]
- Bossuyt B, Honnay O, Hermy M. An island biogeographical view of the successional pathway in wet dune slacks. Journal of Vegetation Science. 2003;14:781–788. [Google Scholar]
- Butaye J, Honnay O, Adriaens D, Delescaille L-M, Hermy M. Phytosociology and phytogeography of the calcareous grasslands on Devonian limestone in Southwest Belgium. Belgian Journal of Botany. 2005;138:24–38. [Google Scholar]
- Cavender-Bares J, Ackerly DD, Baum DA, Bazzaz FA. Phylogenetic overdispersion in Floridian oak communities. American Naturalist. 2004;163:823–843. doi: 10.1086/386375. [DOI] [PubMed] [Google Scholar]
- Cornwell WK, Schwilk DW, Ackerly DD. A trait-based test for habitat filtering: convex hull volume. Ecology. 2006;87:1465–1471. doi: 10.1890/0012-9658(2006)87[1465:attfhf]2.0.co;2. [DOI] [PubMed] [Google Scholar]
- Dzwonko Z. Assessment of light and soil conditions in ancient and recent woodlands by Ellenberg indicator values. Journal of Applied Ecology. 2001;38:942–951. [Google Scholar]
- Elias M, Gompert Z, Jiggins C, Willmott K. Mutualistic interactions drive ecological niche convergence in a diverse butterfly community. PLoS Biology. 2008;6:e300. doi: 10.1371/journal.pbio.0060300. http://dx.doi.org/10.1371/journal.pbio.0060300 . [DOI] [PMC free article] [PubMed] [Google Scholar]
- Ellenberg H, Weber HE, Düll R, Wirth V, Werner W. Zeigerwerte von Pflanzen in Mitteleuropa. Scripta Geobotanica. 1992;18:3–258. [Google Scholar]
- Fenner M, Thompson K. The ecology of seeds. Cambridge: Cambridge University Press; 2005. [Google Scholar]
- Firth D. relimp: relative contribution of effects in a regression model. 2008 R package version 1·0-1. http://go.warwick.ac.uk/relimp . [Google Scholar]
- Forbis TA, Floyd SK, De Queiroz A. The evolution of embryo size in angiosperms and other seed plants: implications for the evolution of seed dormancy. Evolution. 2002;56:2112–2125. doi: 10.1111/j.0014-3820.2002.tb00137.x. [DOI] [PubMed] [Google Scholar]
- Grime JP. Trait convergence and trait divergence in herbaceous plant communities: mechanisms and consequences. Journal of Vegetation Science. 2006;17:255–260. [Google Scholar]
- Grootjans AP, Ernst WHO, Stuyfzand PJ. European dune slacks: strong interactions of biology, pedogenesis and hydrology. Trends in Ecology and Evolution. 1998;13:96–100. doi: 10.1016/S0169-5347(97)01231-7. [DOI] [PubMed] [Google Scholar]
- Hanley ME. Seedling herbivory, community composition and plant life history traits. Perspectives in Plant Ecology, Evolution and Systematics. 1998;1:191–205. [Google Scholar]
- Hanley ME, Fenner M, Whibley H, Darvill B. Early plant growth: identifying the end point of the seedling phase. New Phytologist. 2004;163:61–66. doi: 10.1111/j.1469-8137.2004.01094.x. [DOI] [PubMed] [Google Scholar]
- Hanley ME, Cordier PK, May O, Kelly CK. Seed size and seedling growth: differential response of Australian and British Fabaceae to nutrient limitiation. New Phytologist. 2007;174:381–388. doi: 10.1111/j.1469-8137.2007.02003.x. [DOI] [PubMed] [Google Scholar]
- Hardy OJ, Jos L. Interpreting and estimating measures of community phylogenetic structuring. Journal of Ecology. 2008;96:849–852. [Google Scholar]
- Hardy OJ, Senterre B. Characterizing the phylogenetic structure of communities by an additive partitioning of phylogenetic diversity. Journal of Ecology. 2007;95:493–506. [Google Scholar]
- Hodgson JG, Mackey JML. The ecological specialization of dicotyledonous families within a local flora – some factors constraining optimization of seed size and their possible evolutionary significance. New Phytologist. 1986;104:497–515. [Google Scholar]
- Hodkinson DJ, Askew AP, Thompson K, Hodgson JG, Bakker JP, Bekker RM. Ecological correlates of seed size in the British flora. Functional Ecology. 1998;12:762–766. [Google Scholar]
- Kraft NJB, Ackerly DD. Functional trait and phylogenetic tests of community assembly across spatial scales in an Amazonian forest. Ecological Monographs. 2010;80:401–422. [Google Scholar]
- Kraft NJB, Valencia R, Ackerly DD. Functional traits and niche-based tree community assembly in an Amazonian forest. Science. 2008;322:580–582. doi: 10.1126/science.1160662. [DOI] [PubMed] [Google Scholar]
- Lameire S, Hermy M, Honnay O. Two decades of change in the ground vegetation of a mixed deciduous forest in an agricultural landscape. Journal of Vegetation Science. 2000;11:695–704. [Google Scholar]
- Legendre P, Lapointe FJ, Casgrain P. Modeling brain evolution from behavior – a permutational regression approach. Evolution. 1994;48:1487–1499. doi: 10.1111/j.1558-5646.1994.tb02191.x. [DOI] [PubMed] [Google Scholar]
- Leishman MR, Westoby M. The role of seed size in seedling establishment in dry soil conditions – experimental evidence from semi-arid species. Journal of Ecology. 1994;82:249–258. [Google Scholar]
- Leishman MR, Wright IJ, Moles AT, Westoby M. The evolutionary ecology of seed size. In: Fenner M, editor. Seeds – the ecology of regeneration in plant communities. Wallingford, UK: CAB International; 2000. pp. 31–57. [Google Scholar]
- Lord J, Westoby M, Leishman M. Seed size and phylogeny in six temperate floras – constraints, niche conservatism, and adaptation. American Naturalist. 1995;146:349–364. [Google Scholar]
- Martin AC. The comparative internal morphology of seeds. American Midland Naturalist. 1946;36:513–660. [Google Scholar]
- Mayfield MM, Levine JM. Opposing effects of competitive exclusion on the phylogenetic structure of communities. Ecology Letters. 2010;13:1085–1093. doi: 10.1111/j.1461-0248.2010.01509.x. [DOI] [PubMed] [Google Scholar]
- Mazer SJ. Ecological, taxonomic, and life history correlates of seed mass among Indiana cune angiosperms. Ecological Monographs. 1989;59:153–175. [Google Scholar]
- Moles AT, Ackerly DD, Webb CO, et al. Factors that shape seed mass evolution. Proceedings of the National Academy of Sciences, USA. 2005;102:10540–10544. doi: 10.1073/pnas.0501473102. [DOI] [PMC free article] [PubMed] [Google Scholar]
- Ojeda F, Pausas JG, Verdú M. Soil shapes community structure through fire. Oecologia. 2010;163:729–735. doi: 10.1007/s00442-009-1550-3. [DOI] [PubMed] [Google Scholar]
- Pausas JG, Verdú M. The jungle of methods for evaluating phenotypic and phylogenetic structure of communities. BioScience. 2010;60:614–625. [Google Scholar]
- Price JN, Hiiesalu I, Gerhold P, Pärtel M. Small-scale grassland assembly patterns differ above and below the soil surface. Ecology. 2012 doi: 10.1890/11-1942.1. in press. http://dx.doi.org/10.1890/11-1942.1 . [DOI] [PubMed] [Google Scholar]
- Prinzing A, Reiffers R, Braakhekke WG, et al. Less lineages – more trait variation: phylogenetically clustered plant communities are functionally more diverse. Ecology Letters. 2008;11:809–819. doi: 10.1111/j.1461-0248.2008.01189.x. [DOI] [PubMed] [Google Scholar]
- R: a language and environment for statistical computing. Vienna, Austria: R Foundation for Statistical Computing; 2008. R Development Core Team. http://www.R-project.org . [Google Scholar]
- Soriano D, Orozco-Segovia A, Márquez-Guzmán J, Kitajima K, Gamboa-de Buen A, Huante P. Seed reserve composition in 19 tree species of a tropical deciduous forest in Mexico and its relationship to seed germination and seedling growth. Annals of Botany. 2011;107:939–951. doi: 10.1093/aob/mcr041. [DOI] [PMC free article] [PubMed] [Google Scholar]
- Stebbins GL. Flowering plants: evolution above the species level. London: Edward Arnold (Publishers) Ltd; 1974. [Google Scholar]
- Stevens PF. Angiosperm Phylogeny Website. 2001 Version 9, June 2008 [and more-or-less continuously updated since]. http://www.mobot.org/MOBOT/research/APweb/ [Google Scholar]
- Thiolouse JD, Chessel S, Dolédec S, Olivier JM. ADE-4: a multivariate analysis and graphical display software. Statistics and Computing. 1996;7:75–83. [Google Scholar]
- Thomposon K, Hodkinson DJ. Seed mass, habitat and life history: a re-analysis of Salisbury (1942, 1974) New Phytologist. 1998;138:163–167. [Google Scholar]
- Valiente-Banuet A, Verdú M. Facilitation can increase the phylogenetic diversity of plant communities. Ecology Letters. 2007;10:1029–1036. doi: 10.1111/j.1461-0248.2007.01100.x. [DOI] [PubMed] [Google Scholar]
- Vamosi JC, Vamosi SM. Body size, rarity, and phylogenetic community structure: insights from diving beetle assemblages of Alberta. Diversity and Distributions. 2007;13:1–10. [Google Scholar]
- Vamosi SM, Heard SB, Vamosi JC, Webb CO. Emerging patterns in the comparative analysis of phylogenetic community structure. Molecular Ecology. 2009;18:572–592. doi: 10.1111/j.1365-294X.2008.04001.x. [DOI] [PubMed] [Google Scholar]
- Vandelook F, Janssens SB, Probert RJ. Relative embryo length as an adaptation to habitat and life cycle in Apiaceae. New Phytologist. 2012 doi: 10.1111/j.1469-8137.2012.04172.x. in press. [DOI] [PubMed] [Google Scholar]
- Vandervalk AG. Succession in wetlands – a Gleasonian approach. Ecology. 1981;62:688–696. [Google Scholar]
- Verdú M. Tempo, mode and phylogenetic associations of relative embryo size evolution in angiosperms. Journal of Evolutionary Biology. 2006;19:625–634. doi: 10.1111/j.1420-9101.2005.00998.x. [DOI] [PubMed] [Google Scholar]
- Verdú M, Pausas JG. Fire drives phylogenetic clustering in Mediterranean Basin woody plant communities. Journal of Ecology. 2007;95:1316–1323. [Google Scholar]
- Verdú M, Gómez-Aparicio L, Valiente-Banuet A. Phylogenetic relatedness as a tool in restoration ecology: a meta-analysis. Proceedings of the Royal Society B: Biological Sciences. 2012;279:1761–1767. doi: 10.1098/rspb.2011.2268. [DOI] [PMC free article] [PubMed] [Google Scholar]
- Vivrette NJ. Distribution and ecological significance of seed-embryo types in Meditteranean climates in California, Chile, and Australia. In: Arroyo MKT, Zedler PH, Fox MD, editors. Ecology and biogeography of Mediterranean ecosystems in Chile, California and Australia. New York: Springer Verlag; 1995. pp. 274–288. [Google Scholar]
- Webb CO, Ackerly DD, Mcpeek MA, Donoghue MJ. Phylogenies and community ecology. Annual Review of Ecology and Systematics. 2002;33:475–505. [Google Scholar]
- Webb CO, Ackerly DD, Kembell SW. Phylocom: software for the analysis of community phylogenetic structure and character evolution. 2009 doi: 10.1093/bioinformatics/btn358. Version 4·1 URL: http://www.phylodiversity.net/phylocom/ [DOI] [PubMed] [Google Scholar]
- Weiher E, van der Werf A, Thompson K, Roderick M, Garnier E, Eriksson O. Challenging Theophrastus: a common core list of plant traits for functional ecology. Journal of Vegetation Science. 1999;10:609–620. [Google Scholar]
- Westoby M. A leaf-height-seed (LHS) plant ecology strategy scheme. Plant and Soil. 1998;199:213–227. [Google Scholar]
- Wikström N, Savolainen V, Chase MW. Evolution of the angiosperms: calibrating the family tree. Proceedings of the Royal Society B: Biological Sciences. 2001;268:2211–2220. doi: 10.1098/rspb.2001.1782. [DOI] [PMC free article] [PubMed] [Google Scholar]
- Wright IJ, Ackerly DD, Bongers F, et al. Relationships among ecologically important dimensions of plant trait variation in seven neotropical forests. Annals of Botany. 2007;99:1003–1015. doi: 10.1093/aob/mcl066. [DOI] [PMC free article] [PubMed] [Google Scholar]
- Zanne AE, Chapman CA, Kitajima K. Evolutionary and ecological correlates of early seedling morphology in East African trees and shrubs. American Journal of Botany. 2005;92:972–978. doi: 10.3732/ajb.92.6.972. [DOI] [PubMed] [Google Scholar]
Associated Data
This section collects any data citations, data availability statements, or supplementary materials included in this article.