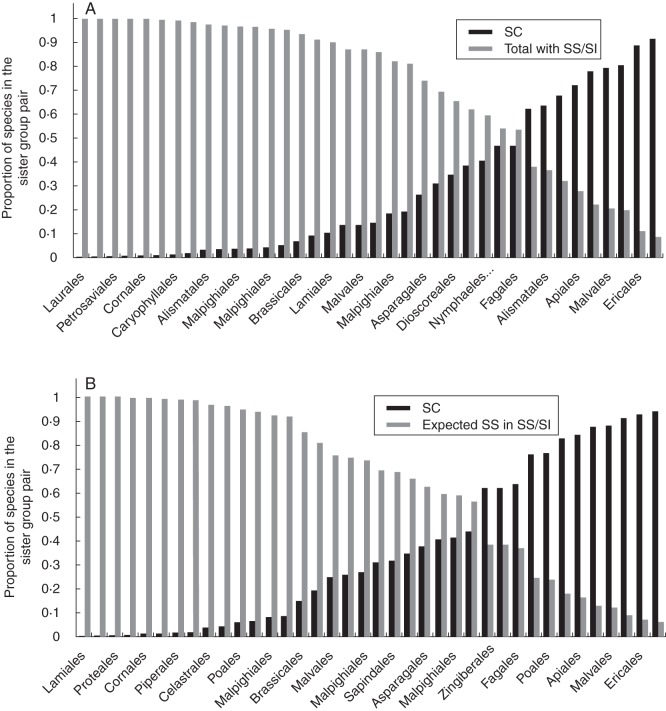
Fig. 7.
Proportion of the total number of species in the sister-group pair bearing SC (black columns) versus (A) the total number of species in the sister clade with SS/SI (grey columns) or (B) the expected proportion of taxa with SS in the clade with SS/SI (grey columns) for each one of the 38 sister group comparisons inferred from the Soltis et al. (2011) topology (those for other comparisons performed are presented in Supplementary Data).

