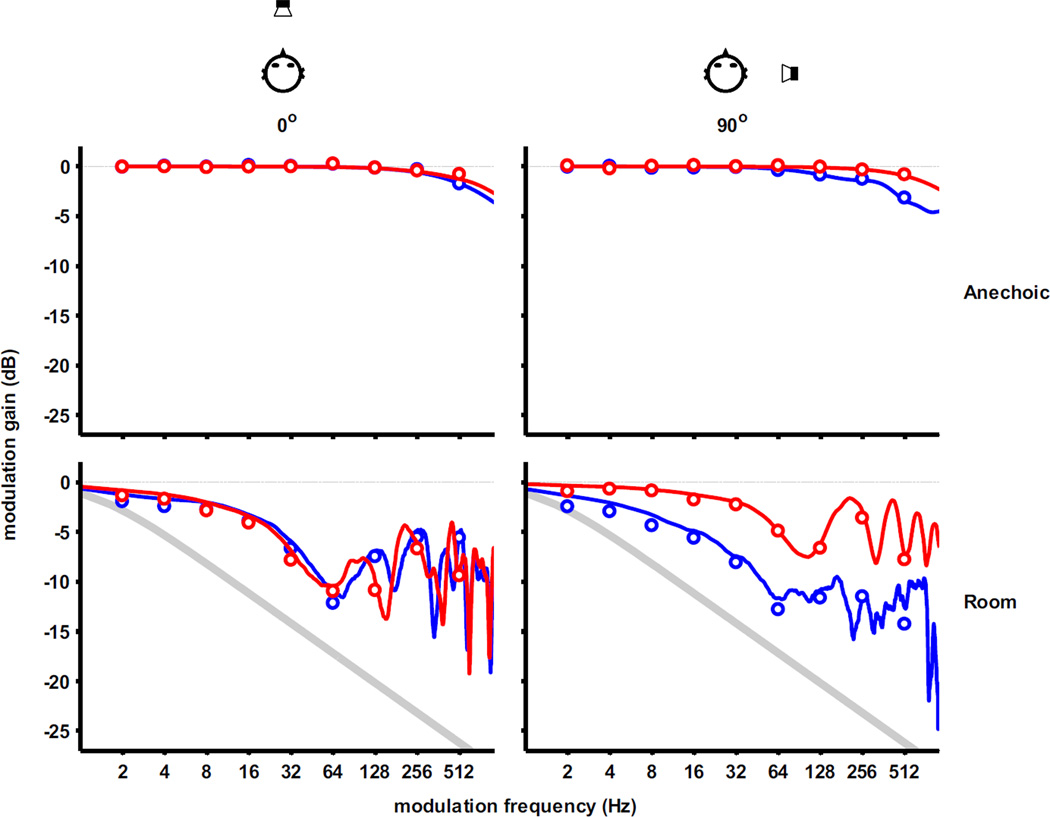
Fig. 2.
Acoustical MTFs for the anechoic and reverberant room sound fields used for testing in this study. MTFs are displayed for both source orientations (0° and 90°) and for both left ( ) and right (
 ) ears; the distance was 1.4 m. The curves represent MTFs computed from HRIRs / BRIRs and the symbols represent results of direct methods of MTF determination (see text for details). Predicted acoustical MTFs for the reverberant room are also displayed based on an algorithm described by Houtgast and Steeneken (1985) assuming exponentially decaying diffuse reverberation, with T60 = 1.8 s.

