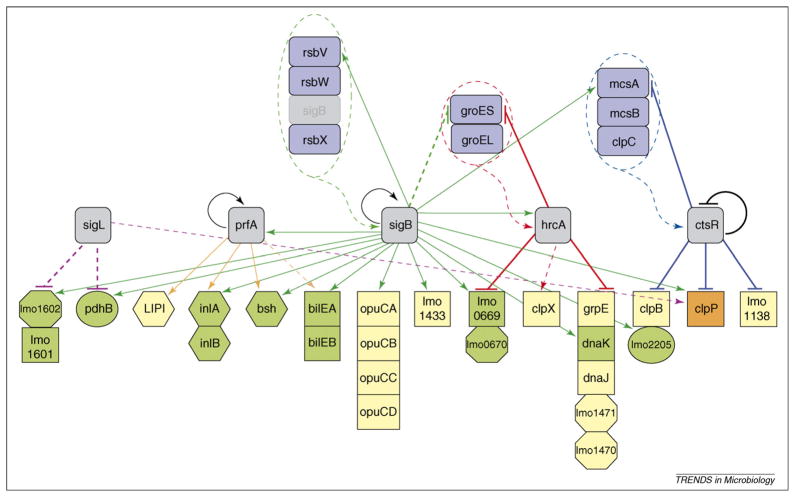
Figure 1.
Partial σL, PrfA, σB, HrcA and CtsR interaction network in L. monocytogenes. The network represented here is based on macroarray data for σL [60] and PrfA [82], and microarray data for σB [25], CtsR [66] and HrcA [67]; data for the bilE operon are based on Ref. [42]. The genes shown were selected specifically to highlight interactions between σL, PrfA, σB, HrcA and CtsR as identified by whole-genome transcriptome analyses and are only a subset of those regulated or co-regulated by the different regulator proteins. Different analytical approaches (e.g. through proteomic or metabolomic strategies) are likely to identify further additional interactions among these and other L. monocytogenes regulatory proteins. Color-coded arrows indicate genes regulated by σL (purple), PrfA (orange), σB (green), HrcA (red) or CtsR (blue). Solid lines indicate direct regulation of a gene by a given regulator as determined by the presence of a PrfA box, σB promoter, HrcA operator site or CtsR operator site; broken lines indicate indirect regulation. Target arrows (↓) indicate positive regulation by a given regulator; target stops (⊥) indicate negative regulation by a given regulator. Loops indicate autoregulation. Color-coded shapes identify (i) transcriptional regulators (gray rounded squares); (ii) genes that regulate a transcriptional regulator (blue rounded rectangles); and (iii) genes regulated by a single transcriptional regulator (yellow), two transcriptional regulators (green) or three transcriptional regulators (orange). Hexagons represent virulence genes (e.g. virulence genes directly regulated by PrfA [i.e. plcA, hly, mpl, actA and plcB] that comprise the Listeria pathogenicity island [LIPI]), squares represent stress-response genes (e.g. grpE encodes heat-shock protein GrpE), circles represent metabolism genes (e.g. lmo2205 and pdhB encode a phosphoglyceromutase and a subunit of pyruvate dehydrogenase, respectively) and octagons represent genes encoding proteins of unknown or other function (e.g. lmo1471 and lmo1470 encode an unknown protein and a ribosomal protein methyltransferase, respectively). Genes arranged in vertical columns represent operons (e.g. lmo0670, which encodes a hypothetical protein, is in an operon with lmo0669, which encodes an oxidoreductase). The green arrow targeting σB indicates post-translational regulation of σB by RsbV, RsbW and RsbX, which are encoded by rsb (regulator of sigma B) genes rsbV, rsbW and rsbX, respectively [30]. The red arrow targeting HrcA indicates post-transcriptional regulation of HrcA by GroES and GroEL, based on evidence reported for B. subtilis [83]. The blue arrow targeting CtsR indicates post-translational regulation of CtsR by McsA, McsB and ClpC, based on evidence reported for B. subtilis [68,69].

