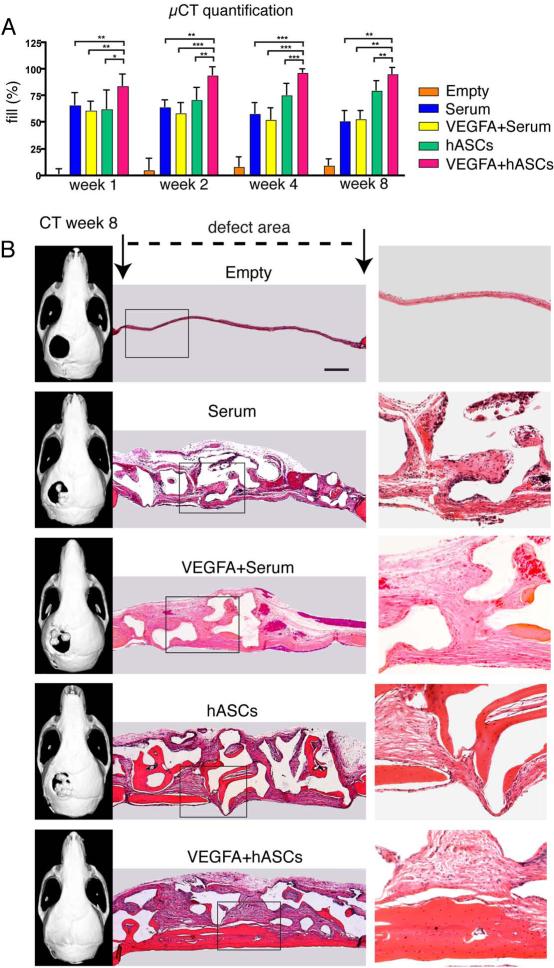
Figure 3.
VEGFA treated hASCs in critical sized calvarial defects. A, Quantification of defect fill according to CT results. Statistical analysis was conducted utilizing the Mann-Whitney Test. P-values: *<0.05, **<0.005 and ***<0.0005. B, representative CT-scans and corresponding H&E staining at postoperative week 8. Boxed areas are enlarged in the right column. Scale bar: 400 μm

