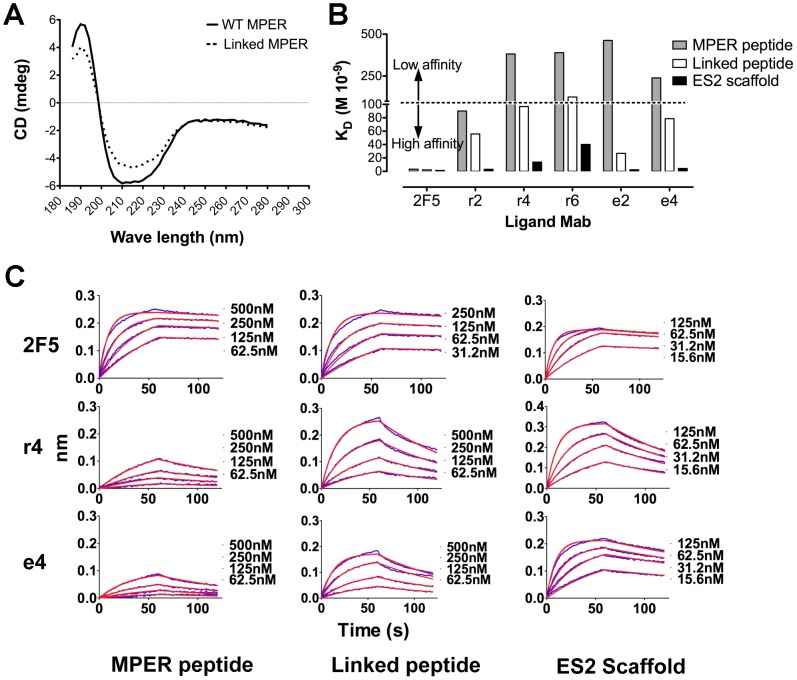
Figure 3. CD analysis and binding kinetics of the CDRH3 length-altered antibodies to selected MPER probes.
(A) CD spectra of 10 µM wt MPER peptide and linked peptide in H2O. (B) Shown on the vertical axis are the affinity constants (KD), of the wt 2F5 Mab and the CDRH3 length-altered variants (r2, r4, r6, e2 and e4) for the selected MPER probes. Gray colored bars indicate antibody interactions with the MPER peptide analyte, white bars represent interactions with the linked peptide, and black bars indicate interactions with the ES2 2F5-epitope scaffold. The dotted line indicates an arbitrary cut off which segregates low affinity interactions (KD>100 nM) from high affinity interactions (KD<100 nM). For a complete description of binding kinetic constants see Table 1. (C) The Octet binding curves of wt 2F5 Mab to the three probes in solution are shown for the wt MPER peptide, the linked peptide, and the ES2 2F5-epitope scaffold. The experimental binding curves are shown in blue and the applied Languir 1∶1 model fitting of the curves are shown in red. Representative binding curves of the CDRH3-length altered 2F5 variants r4 and e4 are shown below. For the binding curves of all variants, see supplementary figures 1S and 2S.

