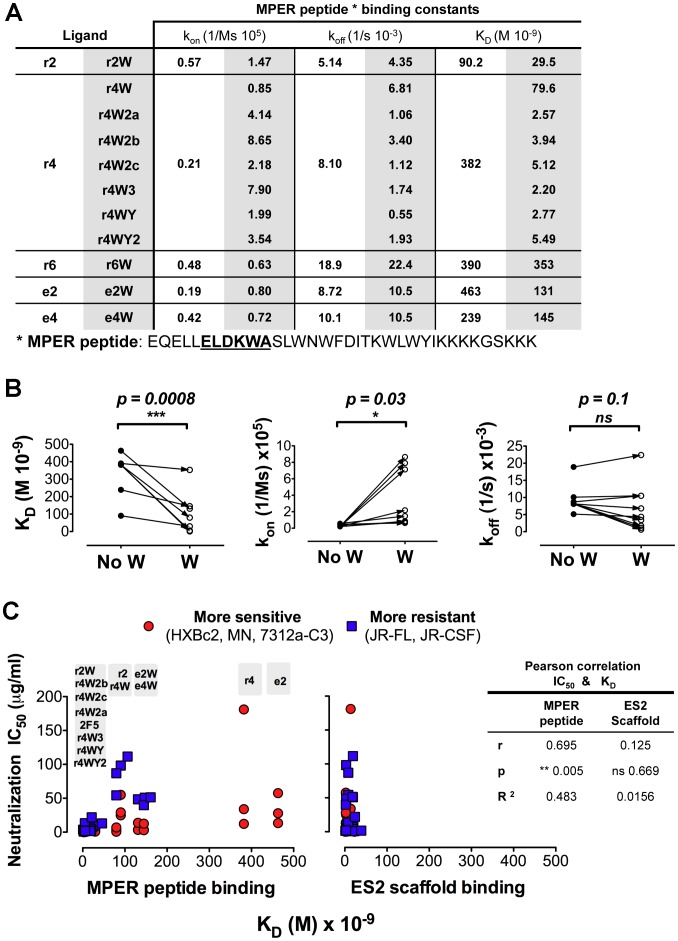
Figure 5. MPER Binding and HIV neutralization of mutant antibodies after W/Y substitutions.
(A) Antibody affinity constants corresponding to antibody binding to MPER peptide before and after the W/Y substitutions, in white and shaded columns, respectively. (B) Statistical analysis comparing the means of the binding measurements to the MPER peptide from the antibodies before and after the W substitutions. The affinity constant (KD), the on-rate (kon) and the off-rate (koff) are shown on the vertical axis with each dot representing antibody binding to the MPER peptide. Closed circles represent antibodies with no Ws in the CDRH3 while open circles represent antibodies with W substitutions. Arrows indicate paired antibodies before and after the substitutions. The p values were obtained by subjecting the data to a paired t test statistical analysis. (C) Correlation between antibody KD to MPER peptide, left panel, or KD to ES2 scaffold, right panel, and HIV neutralization. Antibody IC50 values are shown on the vertical axis and the affinity constant (KD) to the MPER peptide in the horizontal axis. Red circles represent antibody IC50 values against the sensitive viruses (HXBc2, MN and 7312a-C3) and blue squares are IC50 against the more resistant isolates. Above the plots, in the gray boxes, are the names of the antibodies whose measurements are found directly underneath. The data were subjected to a Pearson correlation test, two-tailed resulting in a statistically significant p-value (p = 0.0052) and a positive correlation r-value (r = 0.695 ) for the wt MPER peptide and a non-significant p-value for the ES2 scaffold (p = 0.669 and r = 0.125).

