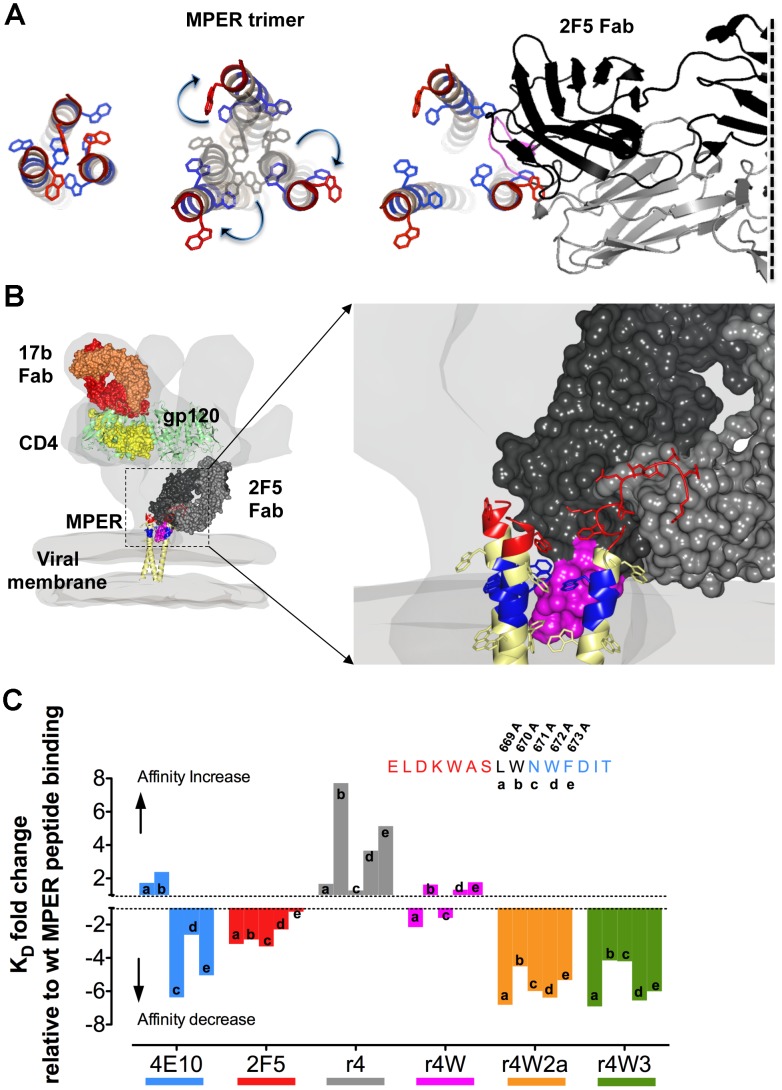
Figure 6. Model of the 2F5 antibody interacting with the HIV spike and MPER alanine scanning mutagenesis.
(A) Left, top view of the trimeric MPER crystal structure (PDB: 3G9R) as it may appear in the HIV unliganded primary isolate trimer prior to receptor engagement. Middle, following receptor engagement there is a putative torsional movement of the individual protomers within the spike, exposing the MPER, as indicated by the blue arrows. Right, when the 2F5 antibody is finally bound to its epitope. (B) Model of the HIV spike with gp120 (green) bound to the antibody 17b (orange), the primary virus receptor CD4 (yellow) (PDB:2NXY) and the MPER (modified from PDB:3G9R) (red [2F5 eptitope], blue [4E10 epitope] and yellow) bound to the antibody 2F5 (black) with the wt CDRH3 (magenta) positioned within the groove between two of the MPER helices. The aromatic residues of the MPER are shown. (C) Alanine scanning of the 4E10 MPER region 669–673 and effects on recognition of 4E10, wt 2F5 and the CDRH3 and W/Y variants are shown. The bars represent fold-increase or -decrease in the binding constant (KD) of the Mabs to the alanine-substituted peptides compared to KDs for the wt MPER peptide. A positive bar indicates an affinity increase and a negative bar indicates an affinity decrease. The bars are color-coded for each ligand Mab. For context, the MPER residues comprising the 2F5 and 4E10 epitopes are shown and the residues 669–673 scanned by the alanine substitutions are as indicated.

