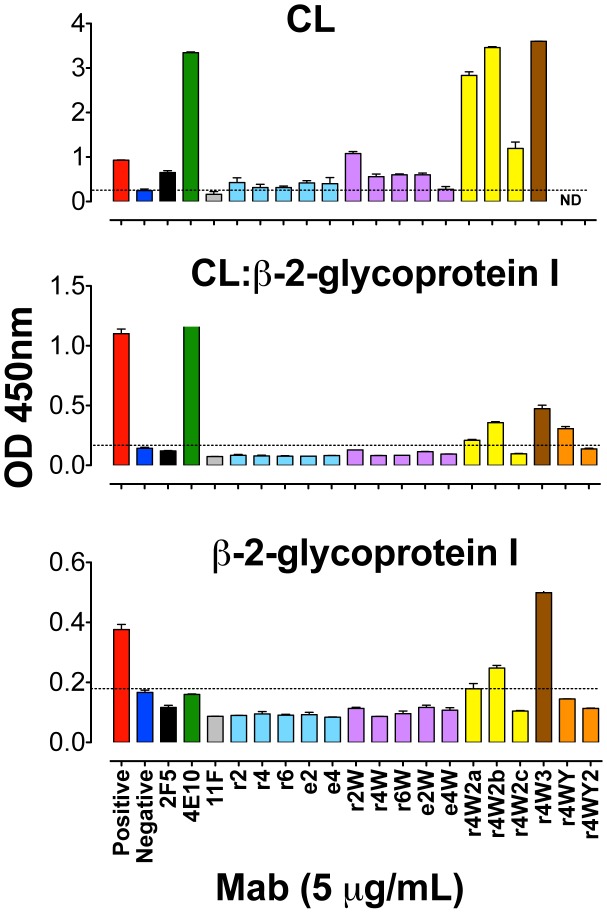
Figure 7. Antibody binding to CL:B2G1.
Bars represent ELISA optical density readings at 450 nm wavelength corresponding to the binding of antibodies (2F5 in black, 4E10 in green, 11F10 in gray and the CDRH3-altered variants in blue, violet, yellow, brown and orange) to CL (top panel), CL:B2G1 complex (middle) and B2G1 (bottom). Light blue color designates CDRH3 altered antibodies with no W substitutions, violet with one W substitution, yellow with two W substitutions, brown with three W substitutions, and orange with one W and one or two Y substitutions. The red and dark blue bars represent the positive and negative binding levels of control IgG included in the assay. The dotted line indicates an arbitrary “cut-off” between the negative and positive values.

