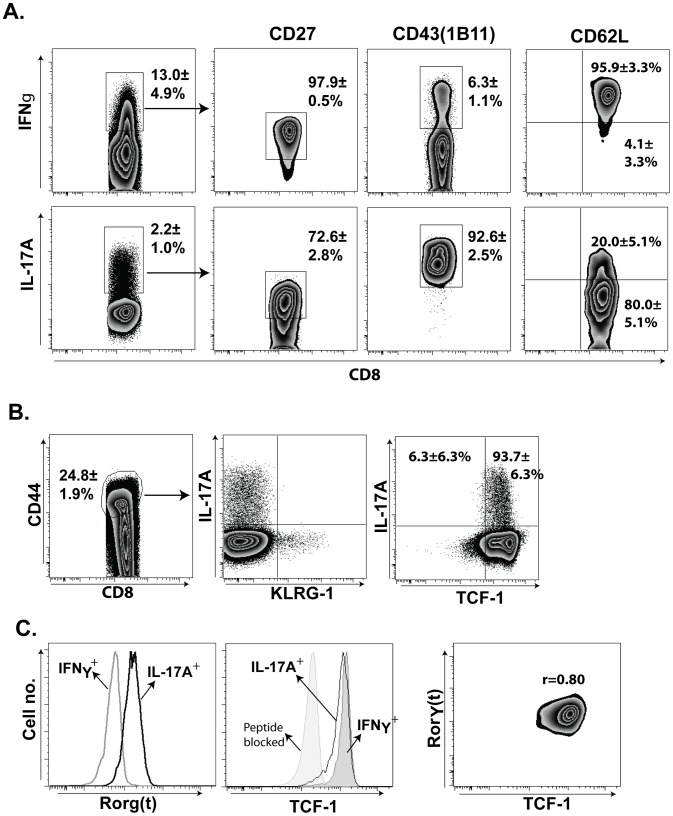
Figure 8. Phenotypic attributes of anti-fungal effector Tc17 cells.
Mice were depleted of CD4+ T cells and vaccinated once as described in Fig. 2. On day 19, dLNs cells were harvested and stimulated ex vivo with anti-CD3 and -CD28 in the presence of Golgi stop and TAPI-2 at 37°C for 5 hrs. Following incubation, cells were surface-stained before staining for intracellular cytokine or transcription factor using phospho-staining kit as in Methods. A. Zebra plots showing percent CD27, CD43 & CD62L of IFN-γ+ and IL-17A+ CD8+ T cells. Values are mean ± SD of 4–5 mice/group. B. Zebra plots show frequency of IL-17+, KLRG-1+ and TCF-1+ among CD8+CD44+ cells. Values are mean ± SD of 4–5 mice/group. C. Left two panels show mean fluorescence (MFI) of RORγt and TCF-1 on IFN-γ+ and IL-17A+ CD8+ T cells. Right panel shows correlation of RORγt and TCF-1 expression on IL-17A+ CD8+ T cells. r = correlation coefficient derived from MFIs. Data are representative of two-independent experiments.

