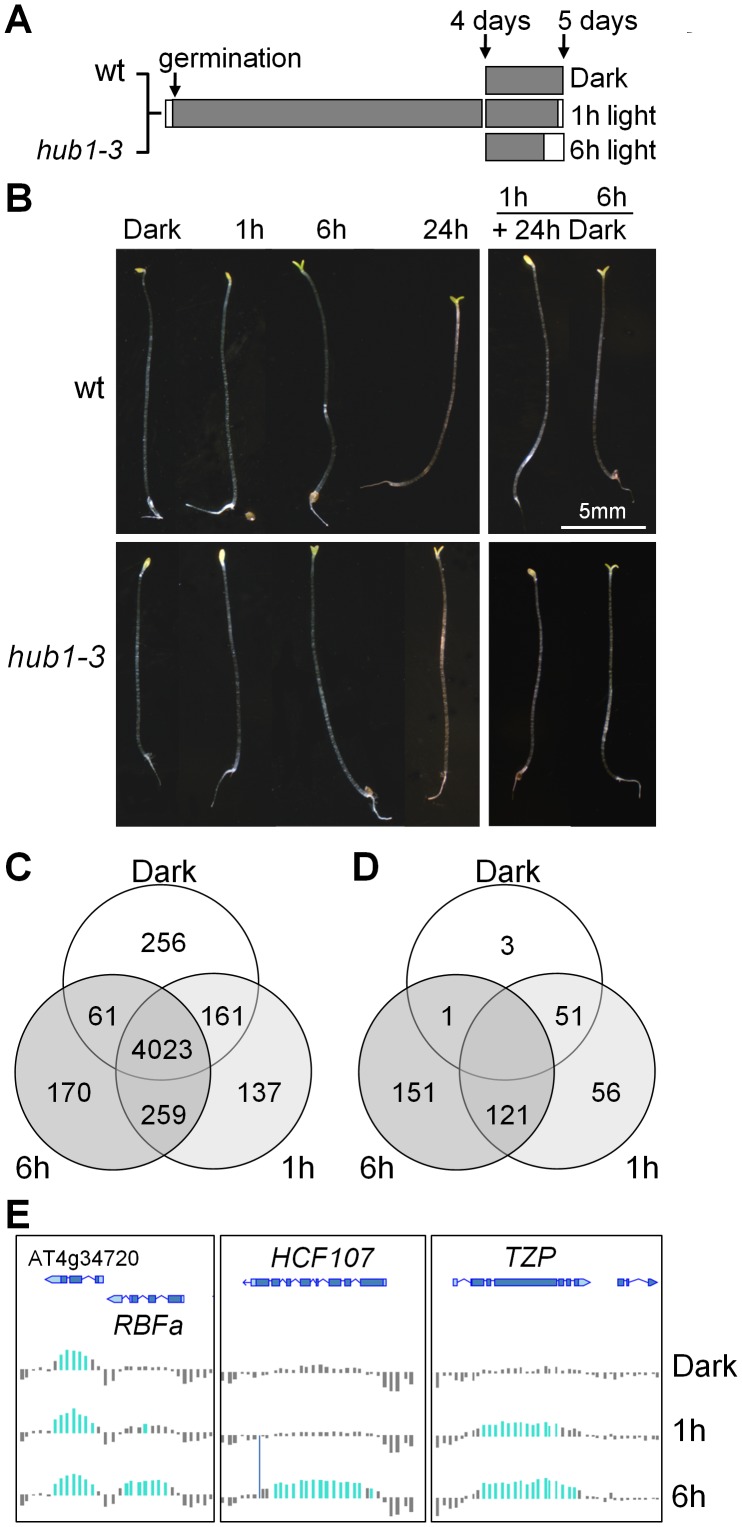
Figure 1. Phenotypic and H2Bub epigenomic changes during de-etiolation.
(A) Experimental design for de-etiolation experiments. Wild-type and hub1-3 plants were grown in darkness for 5 days or shifted to light for the last 1 or 6 h for transcriptome and ChIP-chip analyses. (B) Representative phenotypes of plants grown in darkness and exposed to light for the indicated times (left panels). The right panels illustrate the phenotypes of seedlings transferred back to darkness for 24 h after 1 or 6 h of exposure to light. (C) Venn diagram giving the number of H2Bub-marked genes in each growth condition. (D) Venn diagram giving the number of genes that gain de novo or show a loss of the H2Bub mark during the 6 h window. Determination of the corresponding numbers is detailed in Figure S4. (E) Genome browser screenshot showing H2Bub levels at genomic loci displaying the light-induced genes HCF173, TZP and RBFa. Colored bars represent significant signals for H2Bub-enriched Nimblegen chip tiles normalized from two biological replicates.

