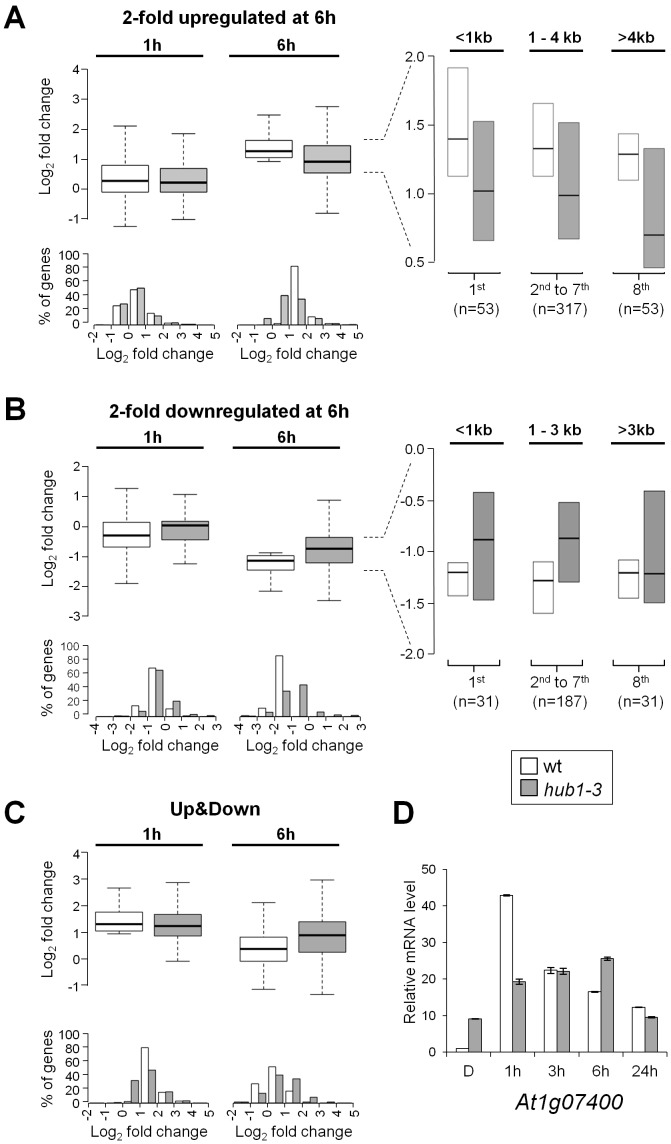
Figure 5. Expression kinetics of light-regulated genes are defective in hub1-3 mutant seedlings.
(A–C) Boxplot (upper panels) and histogram (lower panels) representation of expression changes of light-regulated genes at 1 and 6 h compared to dark. (A) Two-fold upregulated genes at 6 h (n = 423). (B) Two-fold downregulated genes at 6 h (n = 249). (C) Genes showing a rapid modulation of RNA levels, i.e., a 2-fold upregulation at 1 h followed by a downregulation at 6 h compared to 1 h (“Up&Down” genes, n = 162). Boxes show upper and lower quartiles of the data, and the medians are represented by black bars. Histograms show the frequency distribution of log2 expression ratios (x-axis) for wild-type (white) and hub1-3 (grey). The y-axis shows the percentage of genes corresponding to a given expression scale. The insets show genes differentially regulated by light at 6 h in wild-type and hub1-3 divided into 8 quantiles according to gene length, with the extreme groups (<1 kb, >3 kb or 4 kb) analyzed separately from the 6 mid-quantiles. (D) RT-qPCR analysis of a representative “Up&Down” class gene (At1g07400) during de-etiolation in wild-type and hub1-3 seedlings. Etiolated seedlings were harvested in darkness (D) or following the indicated time of illumination. RNA levels are given as in Figure 3A.

