
Figure 2. Helix propensity, expressed as the probability of a given residue being part of a sequence of three consecutive residues whose dihedral angles place them in the  -helical region of conformational space.
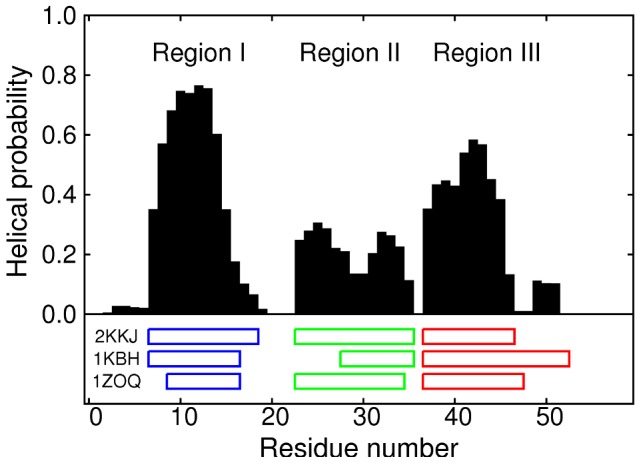
The helical region is defined by  and
and  [70], [36]. The positions of the helices in three PDB structures are indicated beneath the graph: 2KKJ (the core conformer of the unfolded ensemble [46]), 1KBH (the ACTR-bound structure [40]) and 1ZOQ (the IRF-3-bound structure [43]).