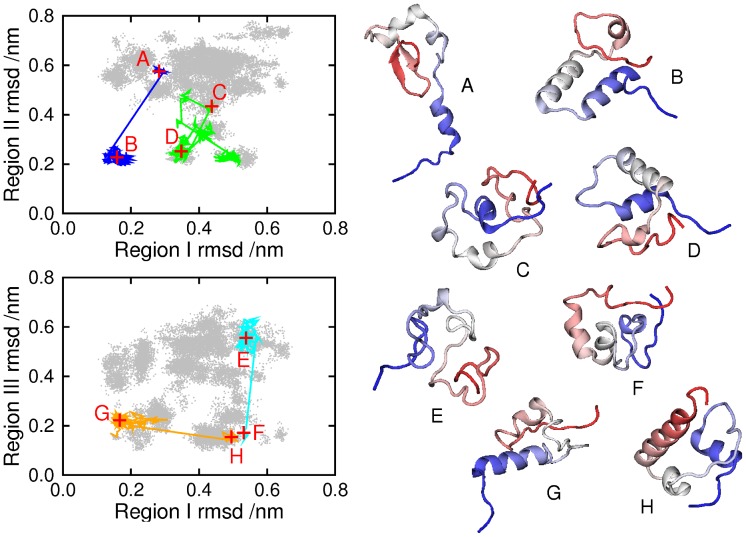
Figure 4. Eight conformations visited during the simulation.
Panels on the left mark these in red, at positions given by the single-region rmsd measures used in Figure 2. The conformations were drawn from four continuous trajectories, also plotted on the panels (only the 304 K parts of each trajectory are shown). A: conformation at 59.36 ns (trajectory 13); B: 178.08 ns (trajectory 13); C: 159.73 ns (trajectory 35); D: 180.67 ns (trajectory 35); E: 72.98 ns (trajectory 37); F: 236.63 ns (trajectory 37); G: 60.39 ns (trajectory 42); H: 215.58 ns (trajectory 42).

