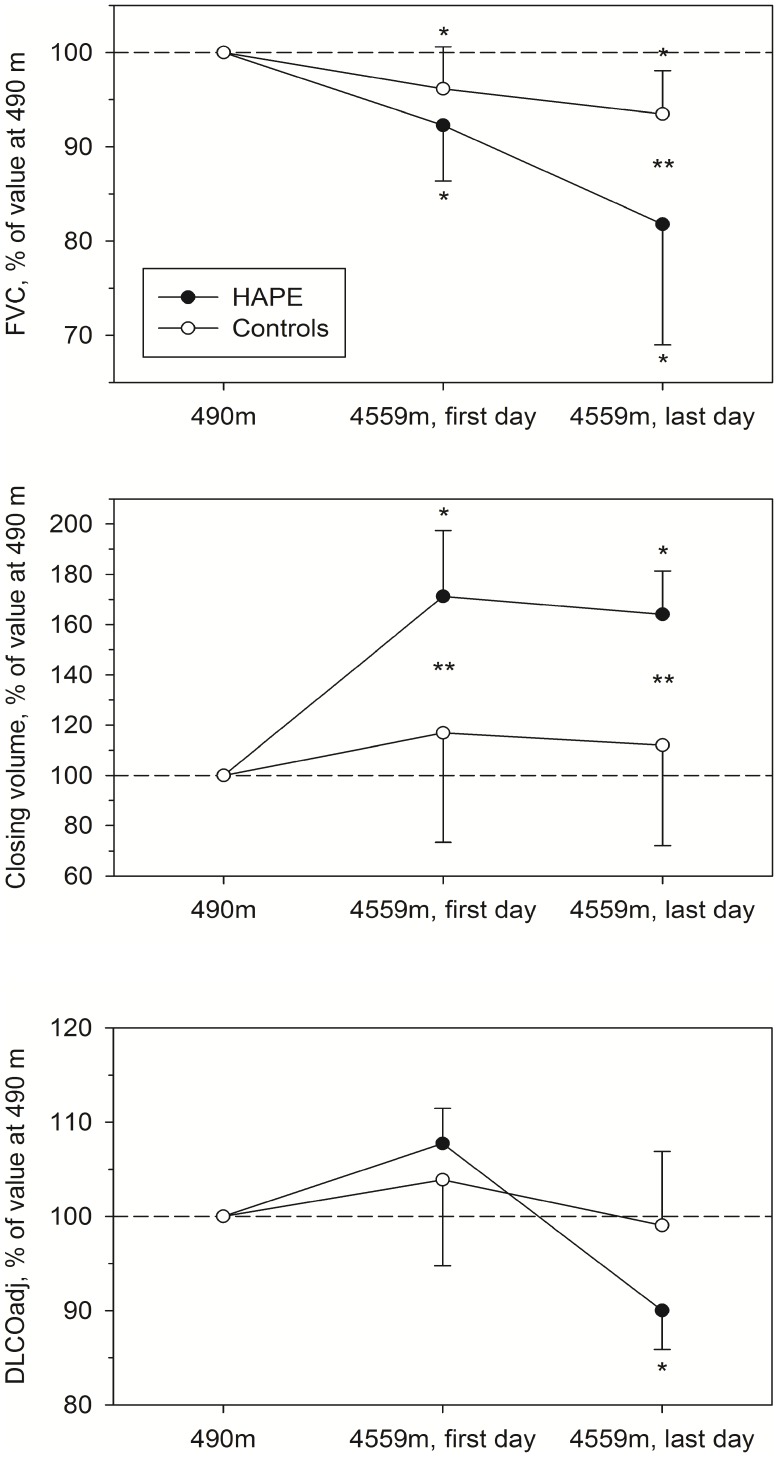
Figure 1. Changes in lung function in subjects developing HAPE and in healthy controls.
FVC (upper panel), closing volume above RV (middle panel) and DLCO adjusted for PIO2 (lower panel), all expressed in percent of the value at 490 m. HAPE = subjects subsequently developing HAPE, controls = subjects not developing HAPE; first and last day at 4559 m = values measured on the day of arrival and either on the last day before clinically overt HAPE occurred, or on day 3 in controls. *P<0.05 vs. 490 m. **P<0.05 vs. controls.

