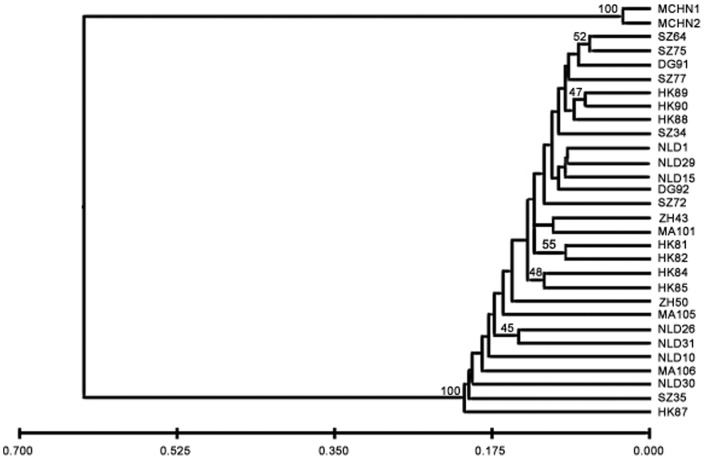
Figure 3. UPGMA dendrogram derived from AFLP data by Nei's [105] unbiased genetic distances.
It shows the relationships among 28 examined populations of Mikania micrantha. Populations of Mikania cordata are used as the root. Numbers above branches indicate bootstrap values (% of 1000 replicates). Only values larger than 40% are displayed. Branch lengths are proportional to genetic distances (see scale at the bottom of figure).

