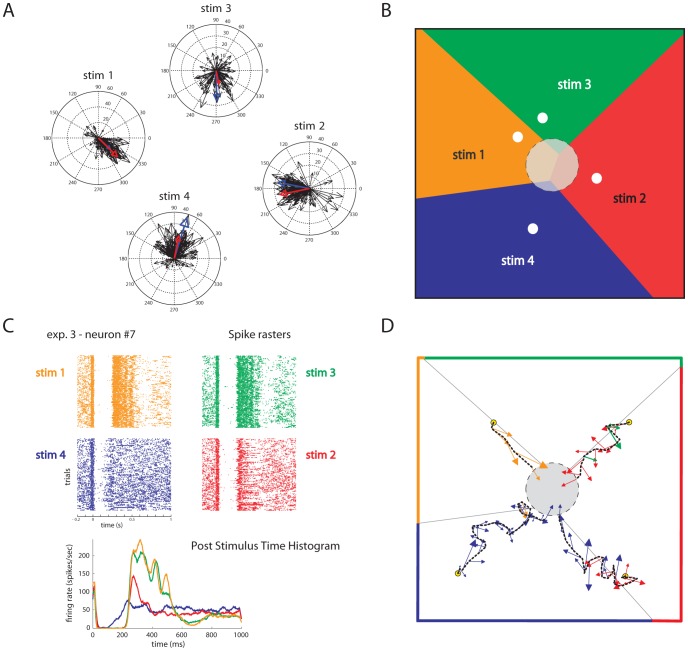
Figure 3. An example of motor and sensory interfaces and on-line closed-loop trajectories generated by evoked activity of a population of neurons.
(A) The output of the motor interface during the test phase is represented as the force vectors (black arrows) generated during 100 “test set” repetitions of each stimulation pattern. The spread of the distribution of the single trial vectors represents neural variability at fixed stimulus. The small discrepancies between the angles of the template vectors computed during calibration (blue arrows) and the trial-averaged vector observed for each stimulus during the test phase (red arrows) originates from differences between training and test dataset due to neural variability and limited sampling. (B) A graphical representation of 4 sensory regions generated by the sensory interface. Each position of the point-mass is mapped onto a stimulation pattern and is color coded. (C) Spike rasters and Post Stimulus Time Histograms (PSTH) of a single neuron evoked by 4 different stimulation patterns, using the same color code as in panel B to distinguish responses to different stimuli. (D) Trajectories of the point-mass (dotted black line) generated on-line starting from 4 different initial points (yellow circles). For each trajectory, the force vector applied step by step by the motor interface to the simulated point-mass is indicated with a color code representing the stimulation pattern chosen by the sensory interface. In this example the forces were applied with an interval of 1 s and the point mass reached the target respectively in 6, 16, 25 and 29 s.

