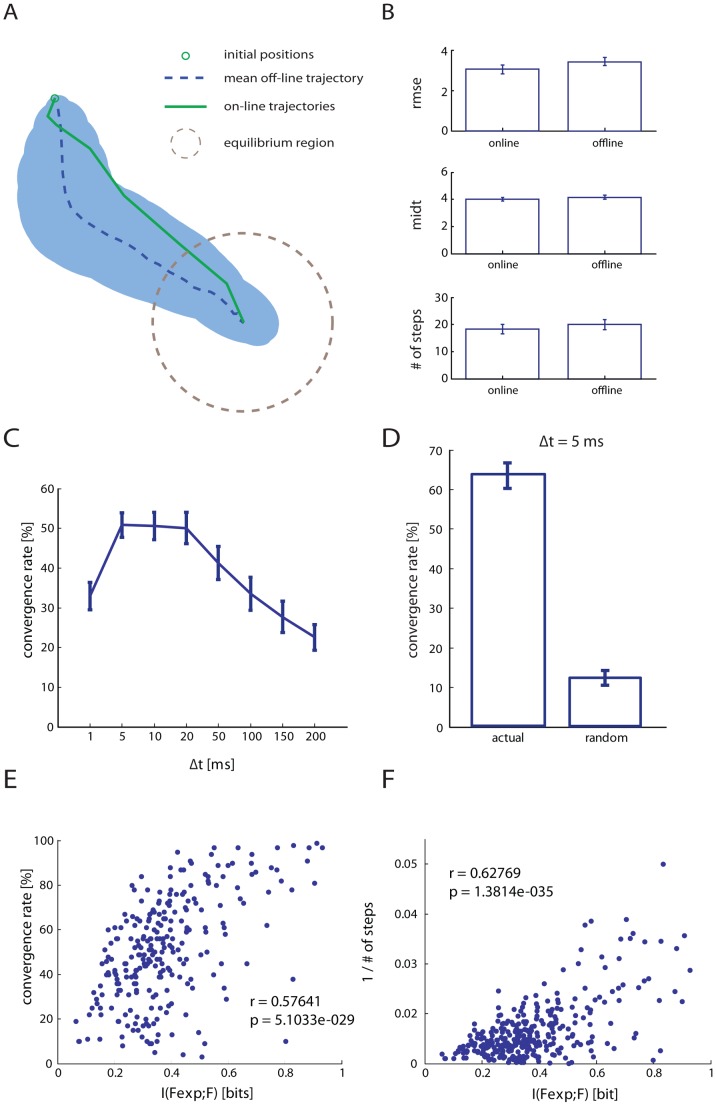
Figure 4. Off-line analysis of dependence of the dNI performances on the temporal parameters defining the neural response.
(A) A closed-loop trajectory recorded on-line (green line) compared to 100 trajectories generated off-line (blue dotted line indicates the mean trajectory and shaded areas represent the p = 0.05 confidence region of trajectory). (B) We compared 70 converging on-line trajectories selected from 13 rats with 70 corresponding off-line trajectories using different parameters such as the root mean square error (RMSE) from the ideal trajectory, the mean integrated distance to target (MIDT) and the number of steps to convergence. Setting the time interval of 1 s between two consecutive steps, these values (mean±SEM: online = 18.2±1.6 and offline = 19.9±1.8) indicate also how long it took for this particular point mass to reach the target. Off-line and on-line behaviors were not significantly different (p>0.1; paired t-test), indicating that off-line simulated trajectories are representative of on-line behavior. (C) Mean convergence rate (CR) subtracted by the mean convergence rate obtained from a random choice of the stimulation patterns, calculated using different sizes for Δt. (D) Mean CR of the dNI calculated using Δt = 5 ms. The CR of the off-line trajectories is used to evaluate the performances of the interface, which is found to be maximal for small temporal resolutions (Δt≈5–10 ms). In particular, by using a bin size of 5 ms the mean CR is 6 times higher than the CR randomly built. The Mutual Information  between the expected force vector and the actual force vector is highly correlated both to the CR (E) and to the inverse of the mean number of steps to convergence (F) calculated for all the simulated off-line trajectories.

