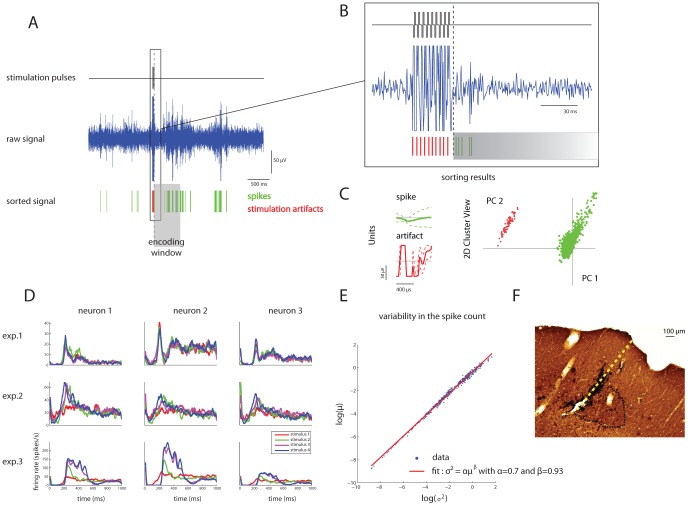
Figure 6. Recorded neural activities in M1 evoked by electrical stimulation in S1.
At the beginning of each experimental session a series of electrical stimulation patterns is delivered and a sorting procedure is performed on the raw neural signal to identify both the stimulation artifacts and the single unit activities. Panels (A) and (B) show a portion of a raw signal close to a stimulation event. The sorting procedure is able of identifying the stimulus artifacts (red lines) and the spike occurrences (green lines). Panel (C) shows the unit templates used by the sorting algorithm (left) and a representation of the sorted data onto the first two principal components plane (right). (D) Post Stimulus Time Histograms (PSTH) of neural evoked responses of a subset of three neurons selected from three experiments. The color code represents different stimulation patterns. (E) Scatter plot of variance vs. mean of spike counts (computed in sliding 20 ms long post-stimulus windows) of all pooled data points across units and sessions. This measure is a relatively standard measure of cortical response variability. The best-fit power law curve ( with α = 0.7 and β = 0.93) is plotted with the best fit parameters. These data are at the most reliable end of the range of response variability reported in the cortical literature. (F) CO stained section (AP = −3.3 mm from bregma) of the rat brain with microelectrode track. The black dotted line indicates the boundary of the barrel. The perpendicular length from the tip of the electrodes (the center of the hole) to the cortical surface measured 730 µm.

