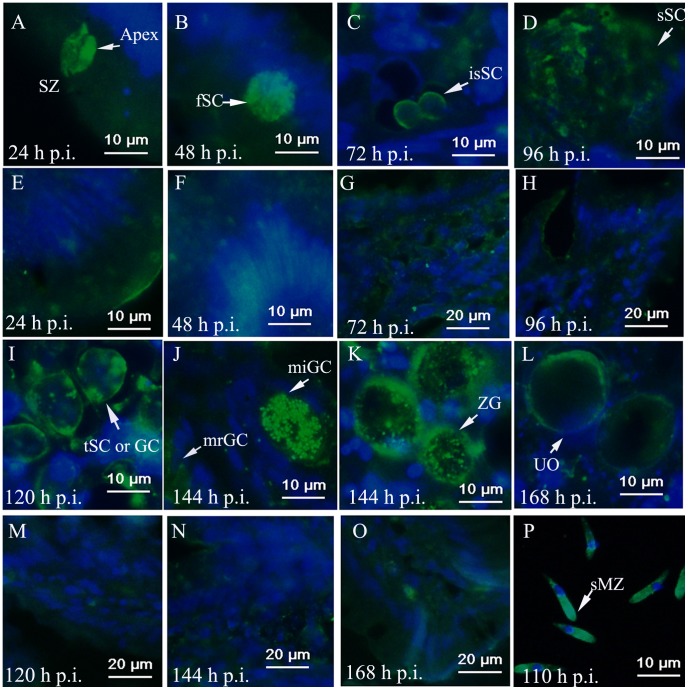
Figure 6. EtAMA1 localization in infected ceca as visualized by immunohistochemistry analysis.
Details of parasites immuno-stained with anti-rEtAMA1 antibodies, visualized with FITC (green) and counter-stained with DAPI (blue), while the normal ceca collected at the same time point as controls. (A) 24-h p.i., sporozoites (SZ); (B) 48-h p.i., first-generation schizonts (fSC); (C) 72-h p.i., immature second-generation schizonts (isSC); (D) 96-h p.i., second-generation schizonts (sSC); (E) 24-h p.i., normal ceca; (F) 48-h p.i., normal ceca; (G) 72-h p.i., normal ceca; (H) 96-h p.i., normal ceca; (I) 120-h p.i., third-generation schizonts (or gametocytes) (tSC or GC); (J) 144-h p.i., microgametocytes (miGC) and macrogametocytes (mrGC); (K) 144-h p.i., zygotes (ZG); (L) 168-h p.i., unsporulated oocysts (UO); (M) 120-h p.i., normal ceca; (N) 144-h p.i., normal ceca; (O) 168-h p.i., normal ceca; (P) 110-h p.i., second-generation merozoites purified from ceca (sMZ).

