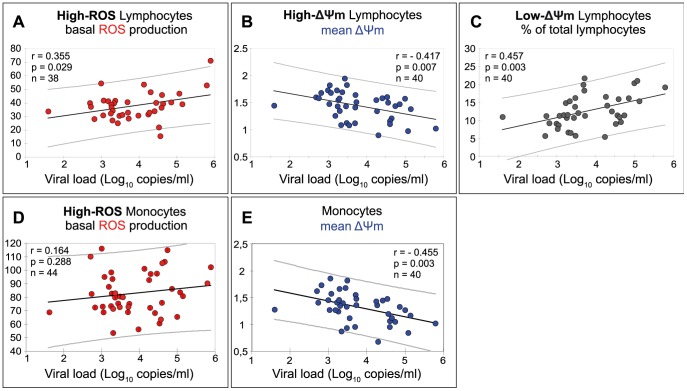
Figure 4. Correlation between mitochondrial functional parameters and viral load in cells from ART naive patients.
(A) ROS production by high-ROS lymphocytes (r = 0.355, p = 0.029, n = 38). (B) ΔΨm of high-ΔΨm lymphocytes (r = −0.417, p = 0.007, n = 40). (C) Percentage of low-ΔΨm lymphocytes (r = 0.457, p = 0.003, n = 40). (D) ROS production by high-ROS monocytes (r = 0.164, p = 0.288, n = 44) (E) ΔΨm of monocytes (r = −0.455, p = 0.003, n = 40).

