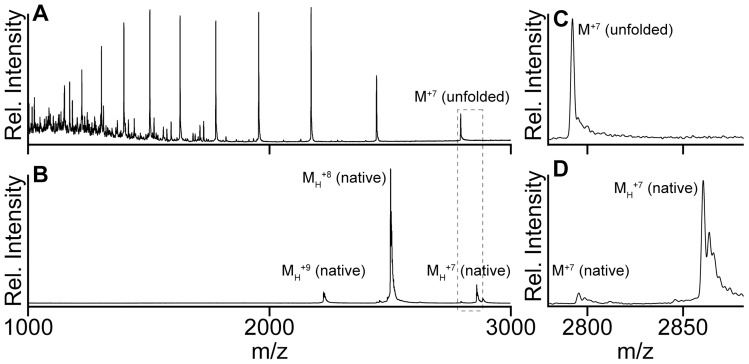
Figure 6. LC-MS and native MS spectra of flavodoxin.
(A) LC-MS spectrum of flavodoxin. (B) Nano-electrospray mass spectrum of flavodoxin. MH +n represents flavodoxin monomer with n positive charges, and M+n is apoflavodoxin monomer with n positive charges. (C and D) Spectra of area indicated by the grey contour in (A) and (B), respectively. Flavodoxin (5 µM) is in 50 mM ammonium acetate, 0.1 mM EDTA, pH 6.8.

