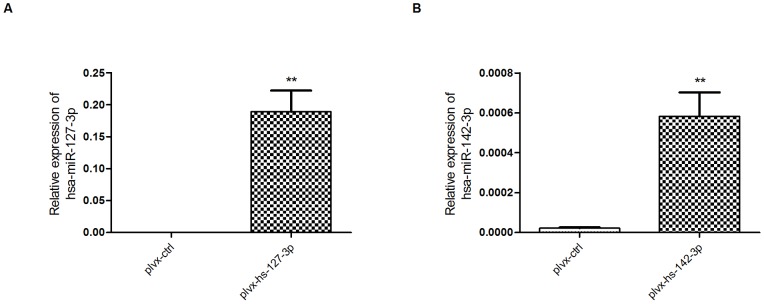
Figure 4. Successful overexpression of hsa-miR-127-3p and hsa-miR-142-3p.
HeLa cells were transfected with the indicated plasmids (400 ng per well) and RNA was collected and extracted 24 h later. Levels of expression of hsa-miR-127-3p (A) and hsa-miR-142-3p (B) were detected using qRT–PCR. Each graph shows the representative result of at least three independent experiments. Relative expression levels (2−deltaCT), to the reference gene RNU48, were plotted. Error bars represent SEMs. ** means p value ≤0.01.

