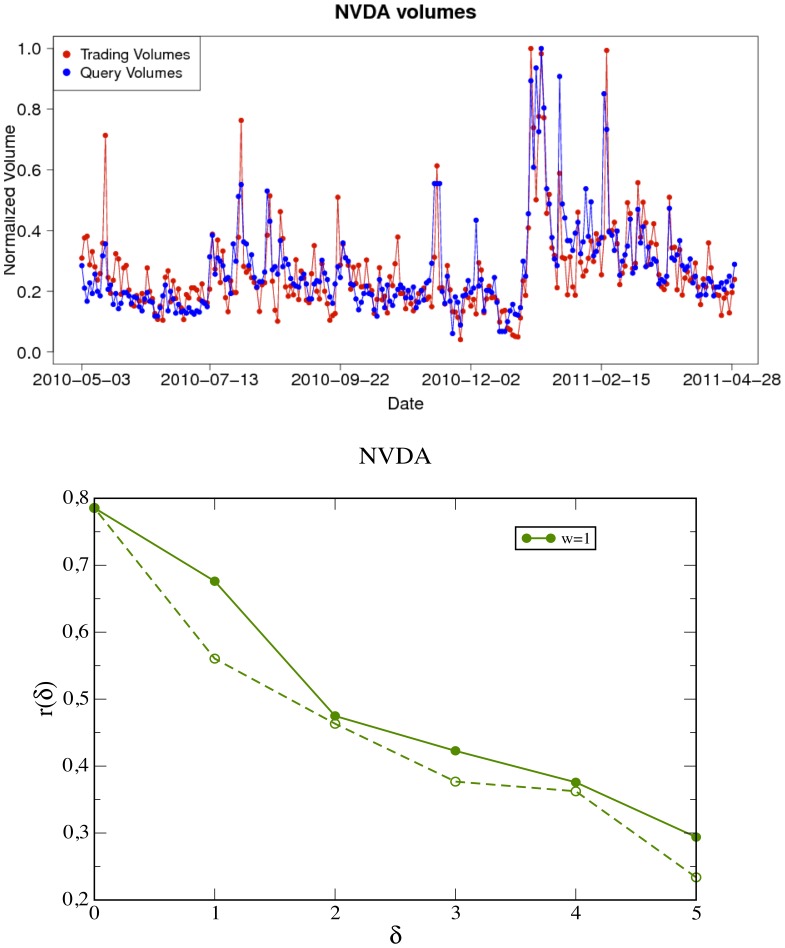
Figure 2. Query log volumes and trading volumes: cross correlation analysis (ticker: “NVDA”).
(up) Time evolution of normalized query-logs volumes for the ticker “NVDA” compared with the trading-volume of the “NVIDIA Corporation”. The data for both query-logs (blue) and trading volume (red) are aggregated on a daily basis. (bottom) The plot of the sample cross correlation function  as defined in Eq. (1)
  absolute values of the time lag
  (positive values of
  correspond to solid lines while negative values of the time lag correspond to the broken lines). The correlation coefficients at positive time lags are always larger than the corresponding at negative ones, this suggests that today’s query volumes anticipate and affect the trading activity of the following days (typically one or two days at most).

