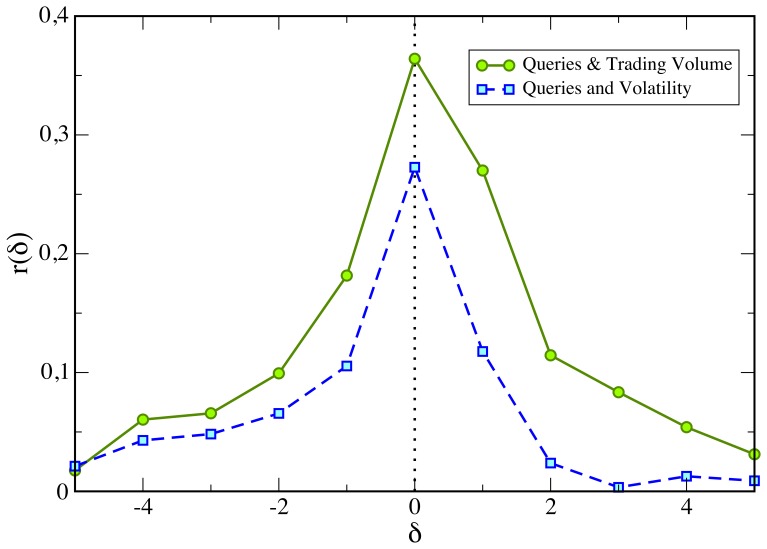
Figure 5. Comparison of the cross-correlation function between query volumes and trading volumes and query volumes and volatility.
Trading volume and volatility are correlated and given the fact that volatility is also autocorrelated, the correlation between present query volume and future trading volume could be simply originated by this autocorrelated term. However, we show that the cross-correlation between query and volatility (broken line) is significantly smaller than the one between query and trading volume (solid line). Moreover the  branch in the volatility case is equal or even smaller than the value observed in the
  one. If the origin of the effect were due to the autocorrelation component of the volatility, we would expect a similar behavior for both cross-correlation function. This facts support that the non-autocorrelated origin of the correlation between between present query volume and future trading volume. As a proxy for the volatility we use the absolute value of daily price returns.

