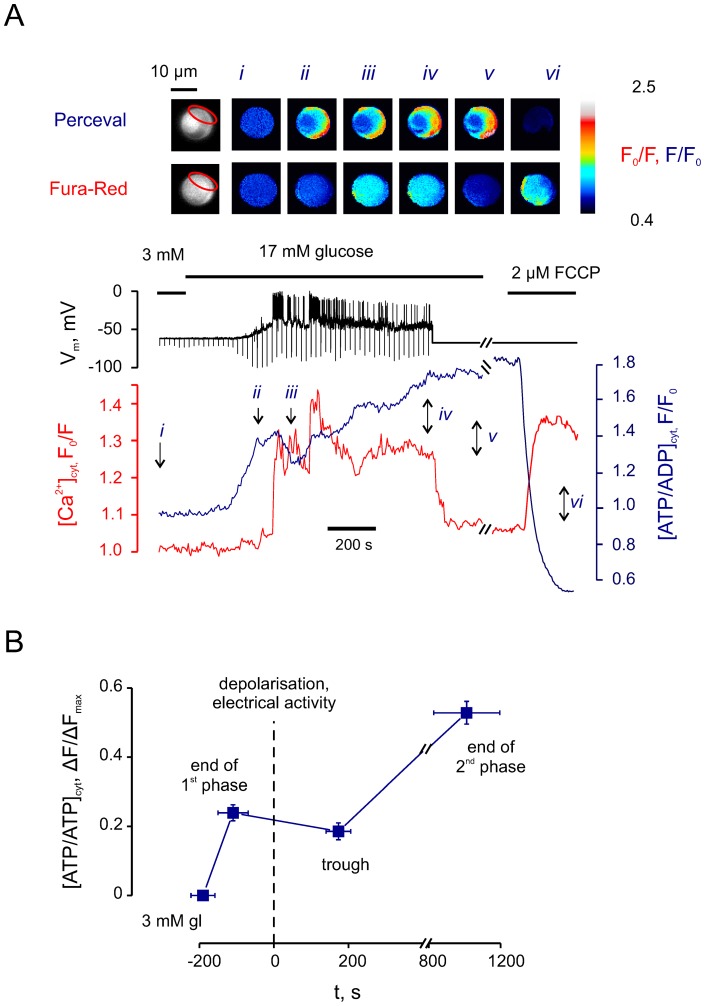
Figure 1. Glucose induces a biphasic increase in cytosolic ATP/ADP ratio.
A: The effects of high (17mM) glucose on [ATP/ADP]cyt (reported with Perceval), [Ca2+]cyt (Fura-Red) and Vm were measured in a single β-cell (representative of n = 30 cells). The voltage down-strokes were elicited by 10 ms 10 pA current injections applied every 20 s to monitor the input resistance which increased upon the elevation of [ATP/ADP]cyt. Inset: Pseudo-colour images of the patched cell cluster presenting pixel-to-pixel ratios at the time points indicated by arrows (i–vi). ROI is indicated with red oval. Note that a cell expressing high levels of Perceval (just below the ROI) was deliberately excluded from analysis. B: Characteristic times and amplitudes of glucose-induced [ATP/ADP]cyt increase in β-cells (Fig. 1A; n = 30). The data were normalised to the width of the range of [ATP/ADP]cyt change (ΔFmax), measured as the difference in Perceval fluorescence between the peak point at 17 mM glucose and the point corresponding to application of 2 µM FCCP. Depolarisation and onset of electrical activity was taken as zero of the time axis. The change in [ATP/ADP]cyt (ΔF/ΔFmax) at each point is significant vs every other point (p<0.01, Wilcoxon's paired test).

