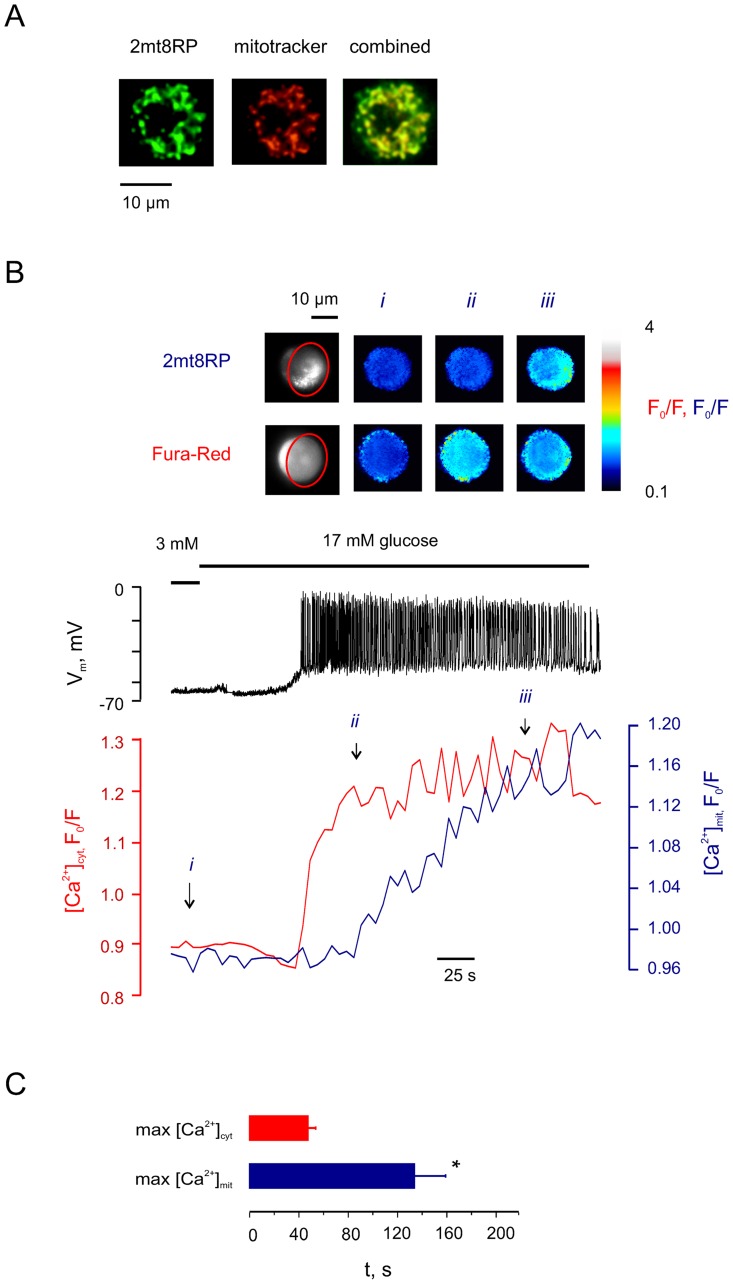
Figure 3. Mitochondrial [Ca2+] follows the increase in cytosolic [Ca2+] with a delay.
A: Colocalisation of 2mt8RP and Mitotracker Orange in a β-cell, 24 h post infection. B: The effect of 17 mM glucose on Vm, [Ca2+]cyt (Fura-Red) and [Ca2+]mit (2mt8RP) in a single pancreatic β-cell (representative of n = 10 cells). Inset: Pseudo-colour images of the patched cell cluster presenting pixel-to-pixel ratios at the time points indicated by arrows (i – iii). ROI is indicated with red oval. C: Mean times of maximal increase for [Ca2+]cyt and [Ca2+]mit in pancreatic β-cells, in response to 17 mM glucose (n = 10 cells). The times are calculated from the moment of the arrival of the first action potential. *Differences are statistically significant (p<0.01).

