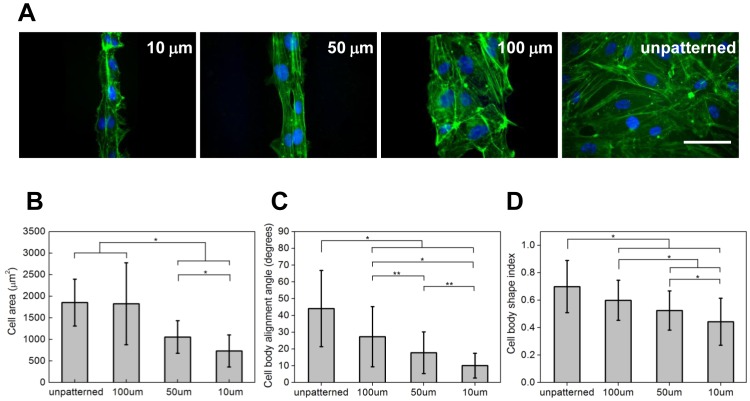
Figure 4. Cell responses induced by the micropatterning of SVVYGLR peptides.
(A) ECs on 10 µm, 50 µm and 100 µm SVVYGLR peptide stripes and on unpatterned surfaces. Cells were labeled with phalloidin and nuclei which are represented in green and blue, respectively. Scale bars correspond to 100 µm. Quantification of (B) mean cell areas, (C) cell body alignment angles and (D) cell shape index of ECs on unpatterned surfaces, on 100 µm, 50 µm and 10 µm SVVYGLR peptide stripes (* p<0.01; ** 0.01<p<0.05).

