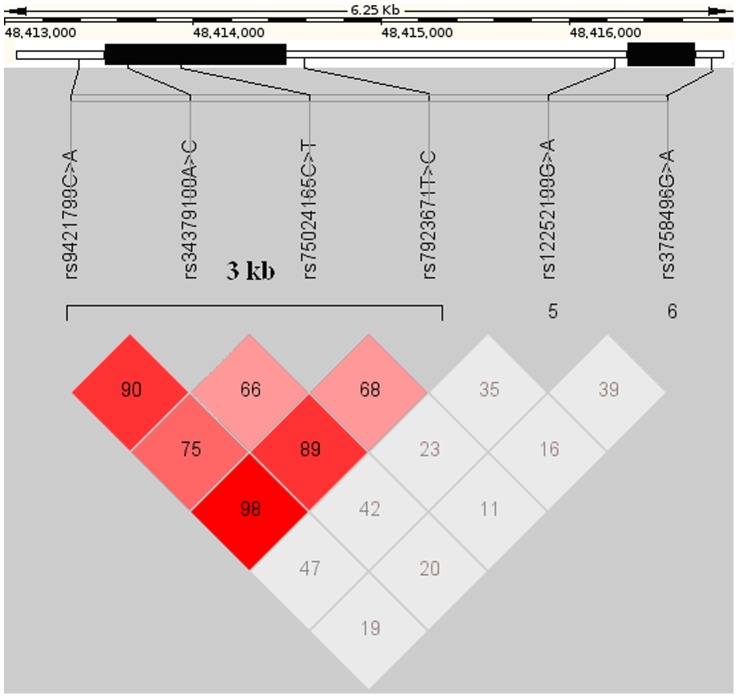
Figure 1. Genomic organization and linkage disequilibrium (LD) mapping of SNPs in a 6 kb genomic region within the BMP9 gene.
The left black bar indicates the exon 2 and the right black bar indicates the exon 1 coding area. Each box represents the D’ value of the LD (range from 0 to 1) between pairs of SNPs. Red, strong LD; grey, high D’/low LOD value; white, low D’.

