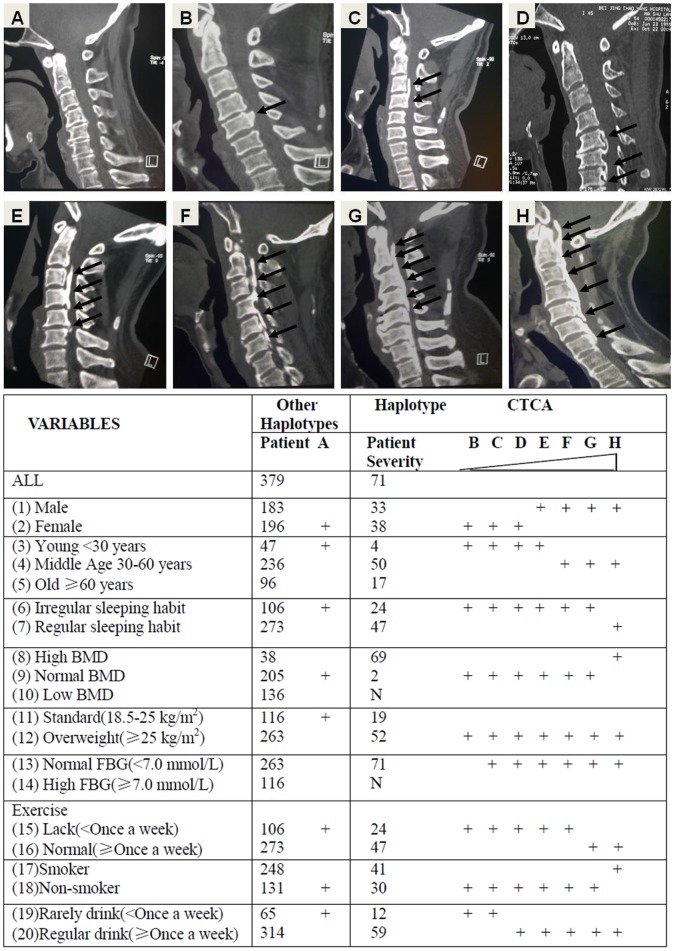
Figure 2. Association between BMP9 Haplotypes and Extent of OPLL related to clinical and demographic characteristics: The upper panel shows Two-dimensional computed tomography (2D-CT) pictures of OPLL severities in cervical spines (C2–7).
Patients A: other haplotypes, Patients B–H: haplotype CTCA. The Table shows ossification severity (B–H) in the CTCA and other haplotype groups related to demographic and clinical characteristics.

