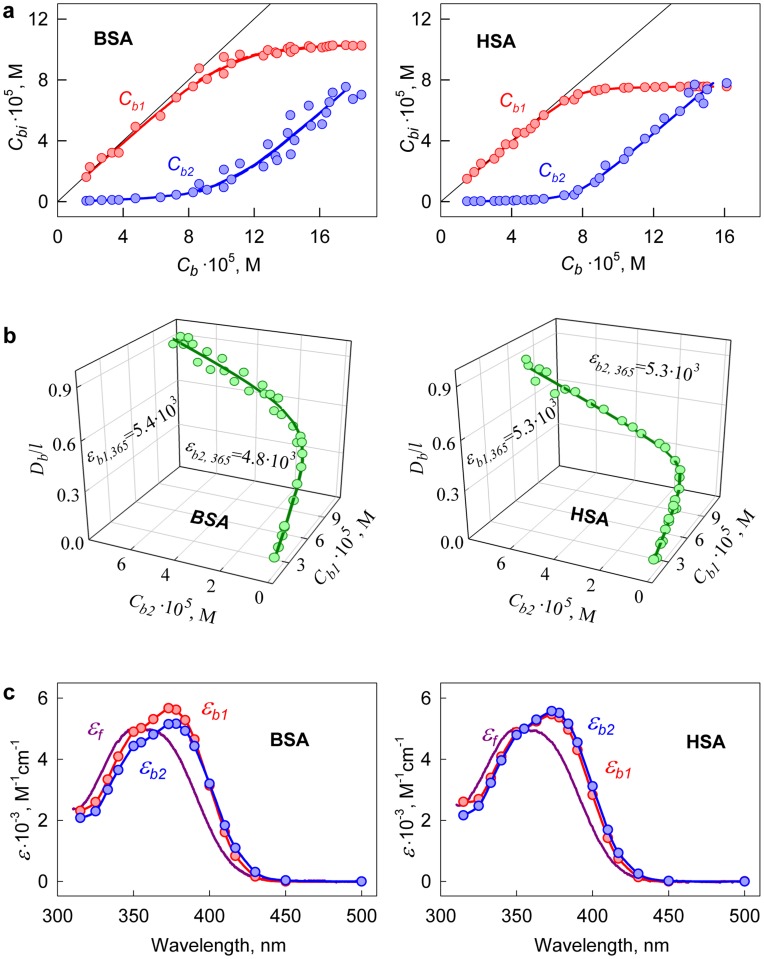
Figure 3. Determination of the molar extinction coefficient of ANS bound to BSA and HSA.
(a) Concentration of ANS bound to proteins (Cb) as a superposition of the concentrations of the dye bound to the sites of mode 1 (Cb1) and mode 2 (Cb2). (b) The dependence  on Cb1, Cb2. In the panel experimental data, best-fit curve and the values of molar extinction coefficients εb1 and εb2 obtained by multiple nonlinear regression are presented. (c) Absorption spectra of ANS bound to the sites of mode 1 and mode 2 in the units of the molar extinction coefficient.

