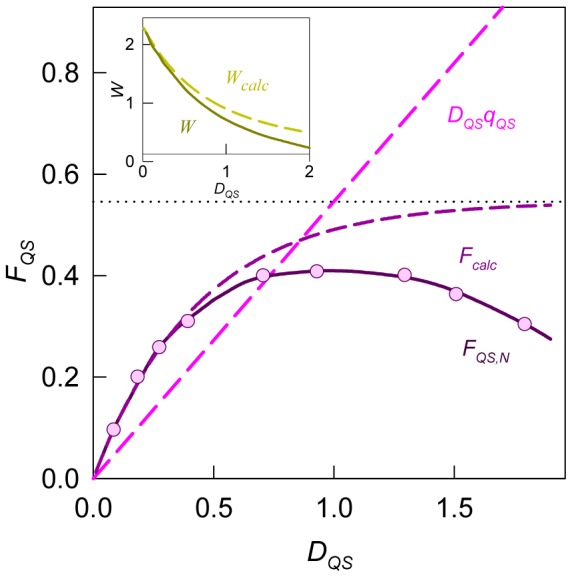
Figure 4. The dependences of fluorescence intensity of quinine sulfate (QS) on its optical density.

 are calculated values and
  are experimentally recorded and normalized values of fluorescence intensity of QS. Dots are the limiting value of
  at
at  . The dependences of calculated values
  and experimentally determined values
  on total optical density are given in the Insert. Strait line is the dependence of
  on
on  (
( ).
).
