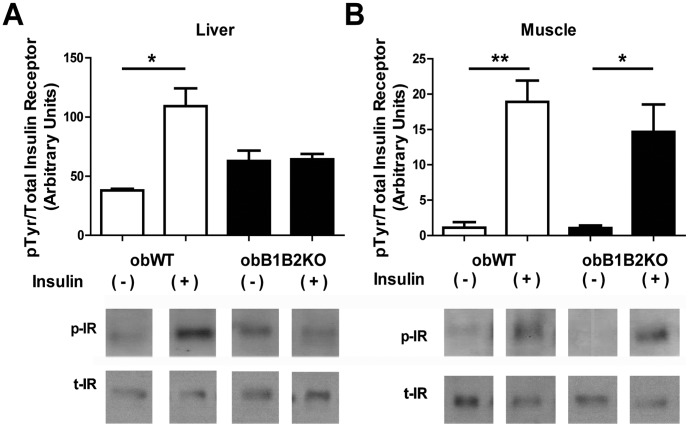
Figure 3. Western blot analysis of liver and muscle insulin receptor phosphorylation.
Graphic and representative images of western blot analysis of phosphorylated insulin receptors (p-IR)/total insulin receptors (t-IR) of protein extracts from A) liver and B) muscle, after immunoprecipitation. Mice were starved for 12 hours overnight. After anesthesia with sodium thiopental, the abdomen was opened and insulin (+) or saline (−) were injected in the cava vein. Liver and muscle samples were collected 2 or 5 minutes after the injections. The data are presented as means ± SEM. *, p<0.05; **, p<0.01.

