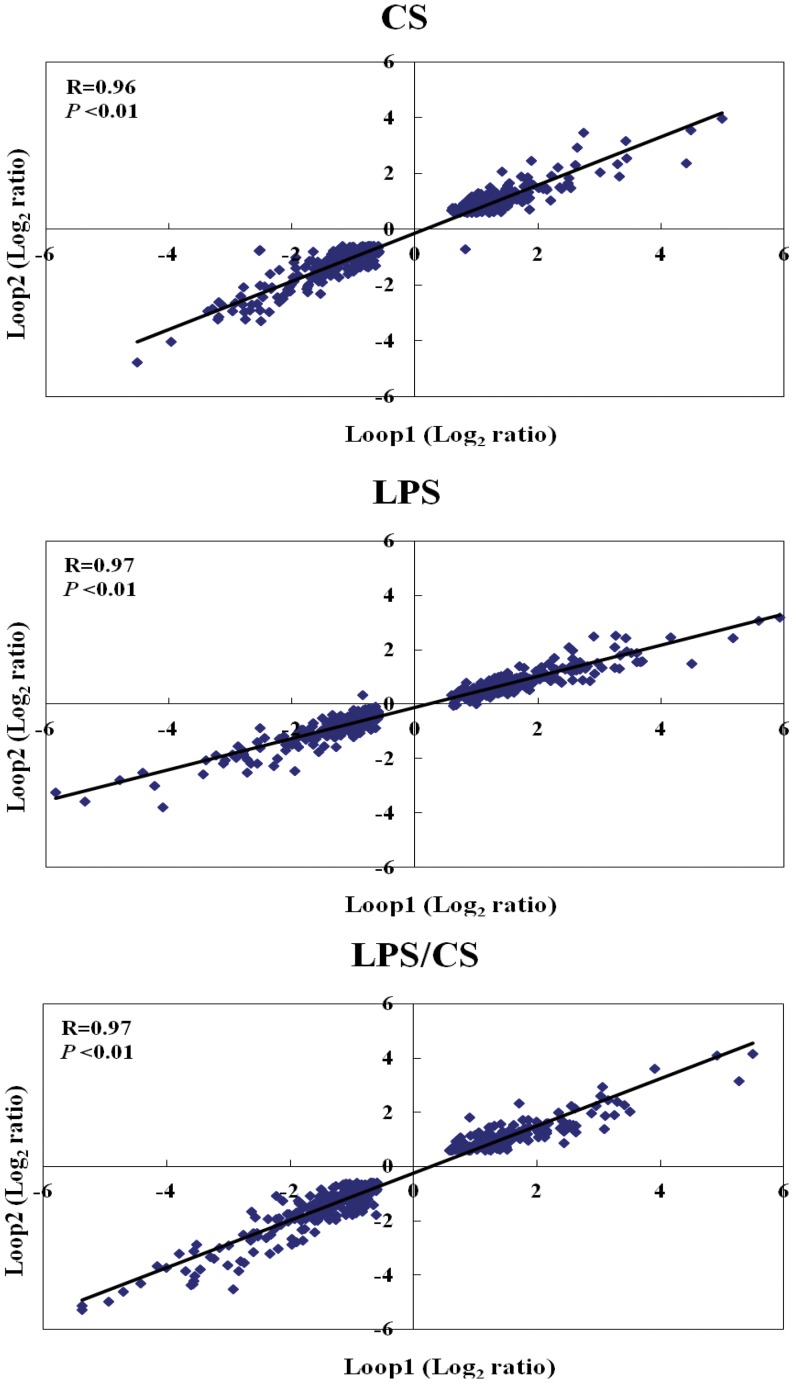
Figure 2. Linear regression of the expression level of common genes found in both sets of loop microarray experiments.
The Numbers of common genes found in both loop microarray experiments under treatment with CS, LPS, or LPS/CS are 405, 490, and 453 respectively. Loop1 and loop2 log2 ratio denotes the expression ratio between control and treatments (CS, LPS, or LPS/CS) regarding duplicate sets of loop microarray experiments. The correlation coefficients (Rs) in the three lists of common genes are 0.96, 0.97, and 0.97, respectively.

