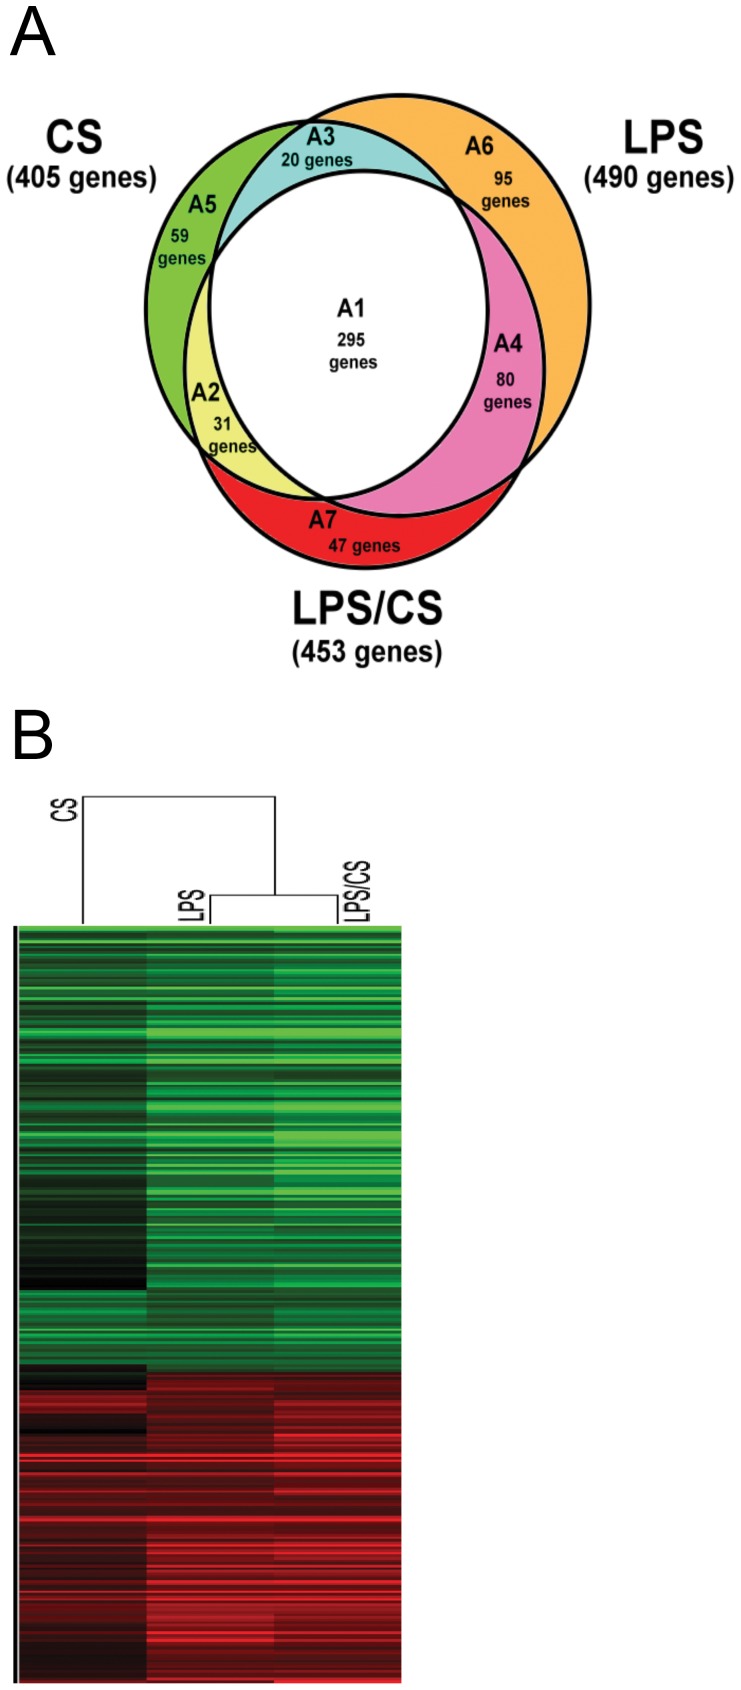
Figure 3. Microarray analysis using intersection analysis and gene clustering.
(A) Assesses the genes uniquely regulated by CS, LPS, and LPS/CS through an intersectional method. The SDE genes obtained in both loop experiments were divided into 7 groups. The different regulation genes of A1, A2, A3, A4, A5, A6, and A7 groups were 295, 31, 20, 80, 59, 95, and 47 genes, respectively. (B) The expression of common genes under treatment with CS, LPS, or LPS/CS( A1 group genes) was analyzed by gene clustering (hierarchical model).

