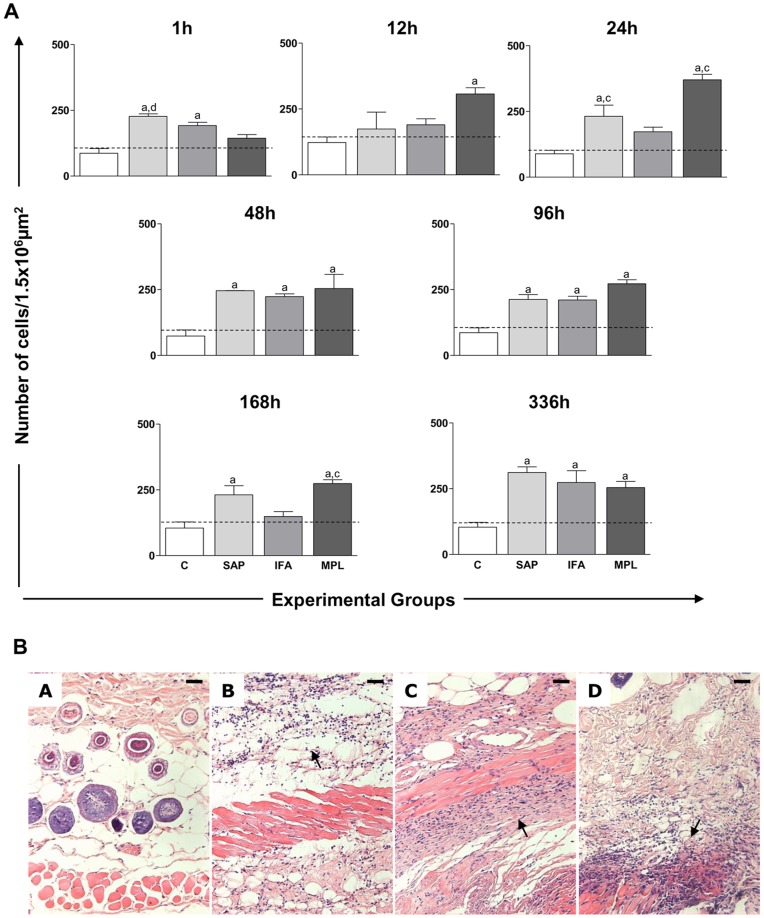
Figure 1. Quantification of the cellular infiltrate in the skin of mice after sensitization with different vaccine adjuvants: saponin (SAP; light gray), incomplete Freund’s adjuvant (IFA; medium gray), and monophosphoryl lipid A (MPL; dark gray) at 1, 12, 24, 48, 96, 168, and 336 h after stimulation.
The control group (C; white) was inoculated with 0.9% sterile saline (A). Significant differences (p<0.05) between groups are represented by the letters a, b, c, and d, referring to the C, SAP, IFA, and MPL groups, respectively, and ANOVA following Tukey’s test was employed. The dashed line represents the average number of cell nuclei quantified in histological sections of the skin mouse sensitized with saline. Data presented are the mean±SD from groups of five animals/evaluation time. (B) Representative photomicrographs of the cellular infiltrate at 48 h is shown at the bottom of Figure 1. Skin mice sensitized with saline and the vaccine adjuvants: Saponin (B), IFA (C), MPL (D) at a magnification of 20×; bar = 100 µm.

