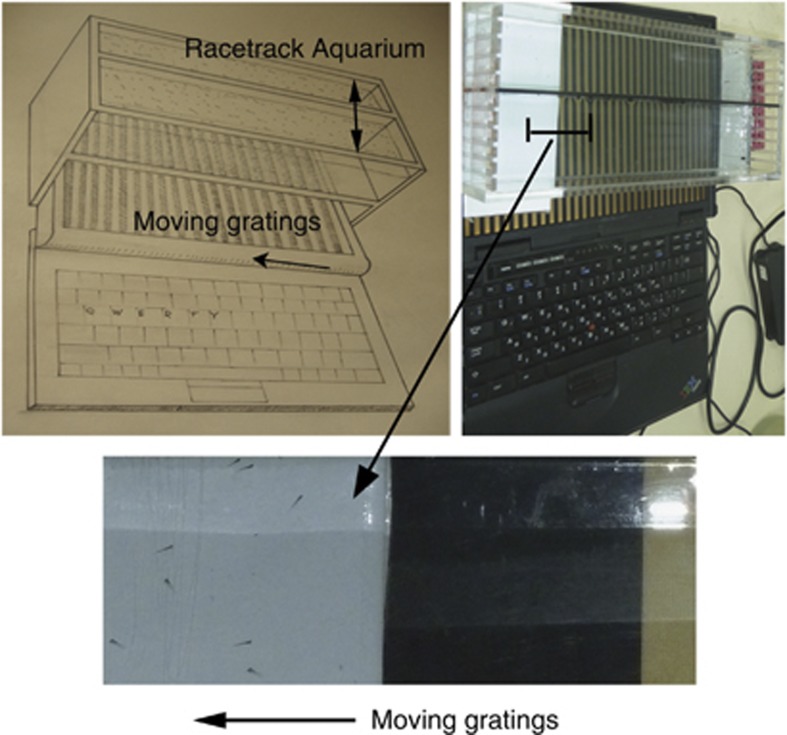
Figure 1.
The optomotor visual assay; diagram (left), photograph (right), close-up (below). A fish aquarium containing two ‘racetracks' is placed above a computer screen. Thirty wild-type larvae are placed in each track. Moving gratings are presented on the screen to the fish larvae through the transparent aquarium. After 90 s of grating presentation, the number of fish in the last one quarter of the track, the target area, is counted and recorded as a proportion of the total number of fish.

